A lot of times people ask me about my favorite web analytics report to start an optimization journey.
For me it feels like an easy to answer question. The success of any online business (website) mainly depends on two factors:
- How many qualified visitors does the website attract and from which channels?
- How many of these qualified visitors perform a desired action?
It’s terrific if 10% of your website visitors order a product. However, if you just receive a few visitors a day it doesn’t mean much.
On the other hand, getting thousands of visitors but a conversion rate of 0,1%, is in general not good either.
You need to have a good balance.
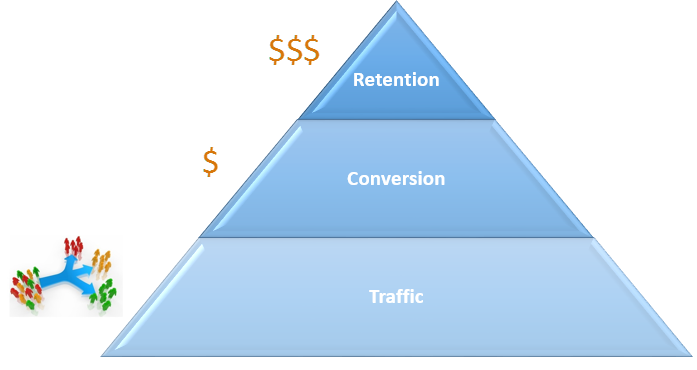
Do you agree with me that traffic + conversion (and retention) are the most important metrics to start looking at?
A simplified view is given below:
 Let’s forget about retention for now.
It’s too complicated to look at retention as your first metric. Optimizing on retention metrics requires in most cases both web analytics as well as back-end data.
Qualified Visitors
What’s a qualified visitor you might think.
There are quite a few definitions out there. I like to explain it in a different way.
I make it as simple as possible by defining four categories of website visitors:
- Group 1: never buys
- Group 2: small chance of buying
- Group 3: big chance of buying
- Group 4: always buys
Based on the definitions above, you like to see many visitors to fall in group 3 and 4.
As an ecommerce shop owner you prefer the number of people that fall in group 1 as low as possible.
In reality it is not so easy to influence the distribution of your website visitors.
However, you can do a lot to improve the chances of buying for people that belong to group 2 and 3.
Especially group 3 is worth investing in!
From experience I can say that making group 1 as small as possible has a lot to do with your targeting.
Who is visiting your website and through which channels?
An example of a channel where many people fall in group 1 or 2, is untargeted email / affiliate marketing campaigns.
I know companies pay lots of money to get people click through to their website to find out no one buys.
It is not unlikely that you see these campaign numbers:
- 20.000 visits
- 98% bounce rate
- CR of 0.001%
Invest enough time in targeting the right visitors and you are halfway in getting great results!
Desired Action
A desired action is always connected to a micro or macro goal on your website.
Most often a micro goal is connected to (one of your) main goal(s).
Your main goal is also defined as your macro goal. It is directly tied to your online business goals.
In the example (last chapter) I talked about “buying”. A desired action is not always connected to a transaction.
It completely depends on your business what a desired action is and what not.
A few examples:
- Subscribing to newsletter (blog)
- Submitting a form (leadgen website)
- Positive support experience (services website)
- Buying a product (ecommerce website)
- Watching a product movie (corporate brand website)
As you can see, there are literally thousands of desired actions you could come up with.
What does this all have to do with the best web analytics report?
By now you will better understand why I choose the All Traffic Sources by Conversion Rate as the best analytics report to start with.
No goals on your website? This can’t be true. No goals means no business.
Best Web Analytics Report
No matter which web analytics tool you use, the all traffic sources report will be available.
Maybe it is named a bit different, but it refers to all channels that drive traffic to your website.
Since most people are used to Google Analytics terminology, I call it All Traffic Sources for now.
It is very easy to open this report in your Google Analytics account.
- Open Google Analytics
- Click on Reporting tab
- Head over to Acquisition
- Click on All Traffic
- Click on Channel or Source / Medium
For an overall picture – and when a lot of sources are involved – I recommend to start on the Channel or Medium level.
In this case I select channel:
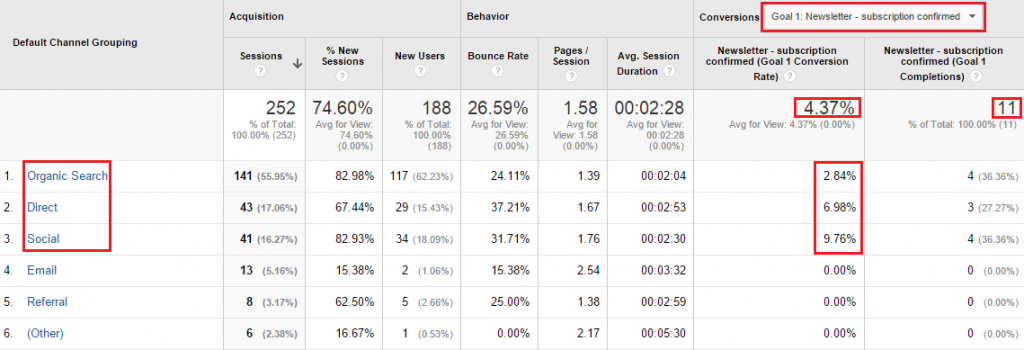
 This is real data from my website.
What do we see here?
- Default channel grouping as primary dimension
- Acquisition, Behavior and Conversions (ABC) statistics for every channel
- Selected goal 1: Newsletter subscription
- CR and number of conversions overall
- CR and number of conversions per channel
On this particular day my CR was well above 4%. My social channel did beat the other traffic sources. There are quite a few direct and organic conversions as well.
This is a simplified example. Can you image the insights you can derive from just this report and a larger data set?
Note: it is very important that you set up your campaign tracking in the correct way. It really ruins your data if you get this wrong.
This report provides you with a first and overall understanding about how your business performs. Of course you need to dig deeper, but it’s a great start!
Concluding Thoughts
The reports that I have shared show you the sources of traffic and outcome (conversions). Two important things you should really care about.
A few last remarks:
- Set up goals and goal values to get this to work.
- Start on the highest level (medium or channel) and drill down to segments.
- Present this Web Analytics report to your boss or client right away and they will love you for the insights they get.
- Offer a few possible solutions on how to optimize each channel and they will love you even more. :-)
- Think about Conversion Optimization (from a holistic viewpoint) as well. Make an optimization plan to improve the outcome for the main online business goal(s).
What’s your favorite web analytics report? How do you start your optimization journey?
One last thing... Make sure to get my automated Google Analytics 4 Audit Tool. It contains 30 key health checks on the GA4 Setup.
Leave a Reply