There are dozens of web analytics metrics available today. Most of them are useful to a certain extent. They should guide you on making important decisions for your business.
What if you interpret your metrics in the wrong way or wrong context? A number can tell a story, but 10 people who see the same number might all tell a different story.
In this article you will learn about five basic web analytics metrics and how to interpret them in a better way.
1. Bounce Rate
Bounce rate is one of the famous metrics in Google Analytics. Many companies tend to base crucial decisions on just this one metric.
The definition that Google Analytics uses:
“Bounce Rate is the percentage of single-page sessions (i.e. sessions in which the person left your site from the entrance page without interacting with the page).”
Let’s break it up a bit so there is no misunderstanding here:
- Single-page sessions: your landing page is the same as your exit page
- No interaction: no interactive event is triggered during your session
Context Delivers Value
From now one refrain from only looking at your web analytics metrics from an aggregated viewpoint.
The context helps you to interpret them in the right way.
- Segment your bounce rate
- Landing page
- Page intent
- Traffic source
- Device category
- Type of visitor
- Bounce rate and type of website
- Blog
- Services website
- Corporate website
- Leadgen website
- Ecommerce website
- Bounce rate and other metrics
- Conversion rate
- Time on page
- Non-pageview interactions
All these factors help you to interpret the bounce rate in a better way.
By itself and on an aggregated level, the bounce rate isn’t actionable at all!
Recommended further reading:
2. Exit Rate
Two years ago I wrote a guide on bounce rates and I directly compared this web analytics metric to exit rates.
“The bounce rate is measured against the number of entrances, the exit rate is measured against a particular page.”
Something to keep in mind:
“A bounce is always an exit, but an exit doesn’t have to be a bounce.”
Actionable Exit Rate
Let’s assume your website counts thousands of pages. What could you do to transform the exit rate into an actionable metric?
Again, context is key. At what pages are you looking? Is there a difference in exit rate on the channel level? What do you want your visitors to achieve?
You need to ask yourself questions to make a metric actionable.
An example:
“You are employed at an E-commerce company and work on a framework for A/B testing purposes. Your manager asks you about the pages to start testing on first.”
In this case you should consider looking at:
- High traffic (funnel) pages
- Pages that are relevant to the shopping process
Try to identify “leaking buckets”: pages with a relatively high exit rate that you need to optimize for higher conversions.
And if you identify one, look at it on a segmented level as well. Is there enough room for improvement in one or more areas?
3. Conversion Rate
As a start I like to ask you a question:
“You measure in Google Analytics 1000 sessions, 500 users and 10 conversions. What is the conversion rate?”
You probably think it should be 1% or 2%:
- Based on sessions: 10 / 1000 = 1%.
- Based on users: 10 / 500 = 2%.
Google Analytics measures the conversion rate based on the number of sessions.
In this case, you will see 1% in Google Analytics. And do you agree with that?
An example:
“You are running a blog like me. One of your main conversions is a newsletter subscription. What you notice is a relatively high amount of returning visitors that convert. It indicates that people come back a few times before they decide to subscribe to your newsletter.”
My journey on your website (I assume you recognize me as one person with four sessions):
 The screenshot above make things a bit more clear to you. I am the same person every day and my conversion rate could be 100% percent or 25% percent. The latter is the value that Google Analytics calculates.
In my opinion, it is more accurate to calculate the conversion rate based on number of users instead of sessions. Or do you think I would subscribe four times to your newsletter? :-)
The Challenge
On default it is pretty hard to get accurate user metrics in your account. Because there are too many devices and browsers in scope that might devalue this web analytics metric.
First of all you need to work with Universal Analytics and implement a UserID. That goes beyond the scope of this article.
Recommend reading:
4. Average Time on Page
First of all, I don’t like averages. Averages are very misleading. You need to know what makes up this average number.
 In the example above you see 22 grades and an average score of 6,5. There are 7 students with a 5 or lower which isn’t a good grade at all!
In general, it’s better to look at distributions instead of averages.
Google Analytics calculates the time on page as follows:
- The time duration between arriving on page one and arriving on page two
If you arrive at my homepage at 11.00am and the next page you see is my blog at 11.02am, you have spent 2 minutes on the homepage.
Take a look at this graph to get a better understanding of how Google Analytics calculates average time on page:
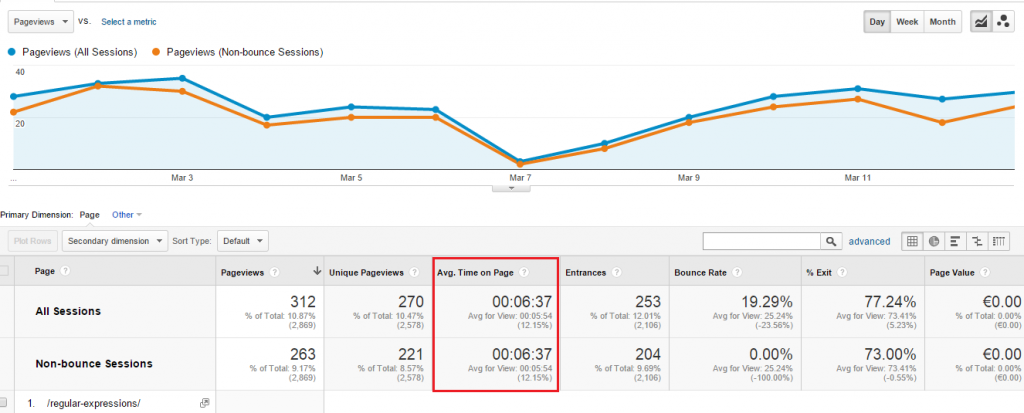
 When calculating average time on page, Google Analytics doesn’t take into account visitors that bounce. The time that you have spent on the last page isn’t measured.
5. Average Time on Site
You need to ask yourself a lot of question to make this metric actionable:
- How does Google Analytics actually calculates average time on site?
- Do I want my visitors to stay longer on my website or is that a sign they can’t find the information quick enough?
- Is there a correlation or possible causation between the average time on site and conversion rate?
And many more things should pop up in your mind when you are working with this metric.
Average time on site = average session duration.
“Google Analytics calculated average session duration as the total duration of all sessions (in seconds) / number of sessions.”
There is one thing you need to understand here. Google Analytics doesn’t measure the time you spend on the last page before you leave. And this has a huge impact on this metric.
Here is an example:
- 11.01am: you arrive on page-a (known)
- 11.05am: you arrive on page-b (known)
- 11.09am: you have finished your reading on page-b and leave the website (unknown)
Your session duration is measured as 4 minutes, but in reality you have spent 8 minutes on this website. Quite a difference!
Maybe you are a technical guy who can come up with a Google Analytics hack, but keep in mind you always need to be careful with that. It might impact other web analytics metrics as well.
Turn Session Duration into Insights
Every metric is useful in its own way.
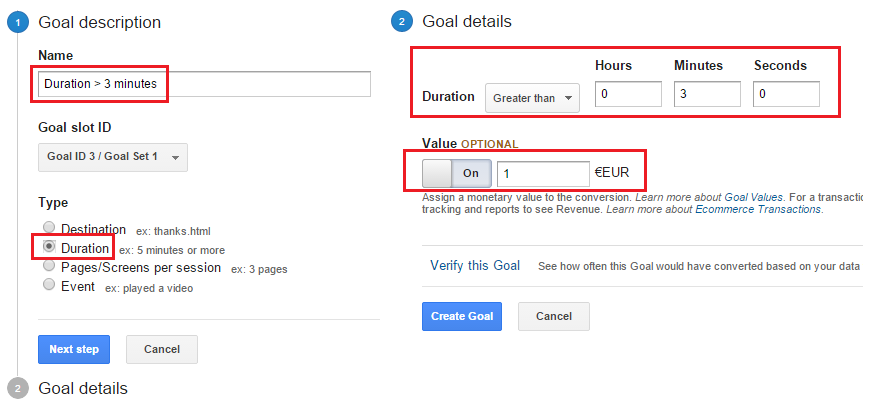
If you want to look closer at session duration, you could set up a few “session duration” goals in Google Analytics:
 You could compare these goals to more important – macro goals – on your website. And find out whether there is a correlation between both.
What is your opinion on web analytics metrics? How do you get the most out of your metrics?
One last thing... Make sure to get my automated Google Analytics 4 Audit Tool. It contains 30 key health checks on the GA4 Setup.
I agree with your list of web analytics metrics mentioned in the post, however I would like to add “Visitors” to the list as it is one of the most important metric when it comes to analytics. Again we can classify visitors into – New Visitors, Unique Visitors and Returning Visitors. So this metric surely provides meaningful and decision making data.
That’s a good metric indeed. However, the usefulness of this metric will always depend on your implementation.