The goal reports in Google Analytics are extremely useful in optimizing your website outcome. But did you ever take a serious look at the reverse goal path reports?
Setting up goals in Google Analytics is a no-brainer. This is something you should always do. How can you expect better results if you don’t know what to optimize?
In addition, defining goal values is a must as well. Absolute numbers and conversion rates are great, but monetary values ($$$) is what get’s attention!
But there is more…
The reverse goal path reports are heavily underused. They can be very useful and I will exactly show you why!
In this article I will use three real-world examples on how to make this report incredibly useful.
1. Sort Out Measurement Issues
“My conversion numbers don’t match our back-end!”
A difference of +/- 5% to 10% between Google Analytics and your back-end is ok in most cases. However, if you see that there is a gap of 20% or more, most probably something is wrong.
In one of my recent audits I found out that Google Analytics measured 25% more conversions compared to the back-end. That was huge!
Here is how I solved the issue:
Step 1: Map out the conversion process to understand the structure and pages involved.
Step 2: Perform a few tests to see how the tracking was set up.
(Real-time reporting, Tag Assistant and Google Analytics Debugger (for Chrome) really come in handy)
After step 1 and 2 I didn’t know yet what was causing the difference between both numbers.
Step 3: Examine the Google Analytics reverse goal path reports.

Bingo! The “Goal Previous Step – 1” indicates that 1 out of 6 conversions happen through a direct entry on the “thank you” page.
On this website, someone had to submit a form before being sent to the actual “thank you” page.
A few reasons why a visitor (let’s call this person Peter) could directly enter the “thank you” page and is counted as a goal:
- Peter has submitted a form in an earlier session and returns back to the “thank you” page in a subsequent session.
- Peter is inactive for more than 30 minutes on the form page and then submits the form.
- Peter is searching in Google for “thank you” page ideas and finds this page ranking high organically.
And there are many more reasons to come up with!
Step 4: Cross-segment direct entries on traffic source and user type.
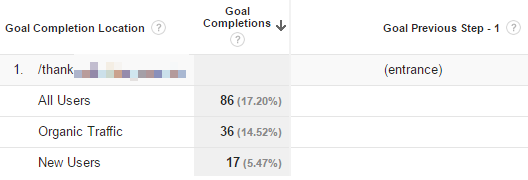 Comparing these numbers with overall stats didn’t reveal any unusual patterns, but I found the “thank you” page being indexed in Google.
Step 5: Send instructions to the webdeveloper.
Of course I had already notified the client by now.
After that I informed the webdeveloper to add a no-index tag to this page. So that the page wouldn’t show up anymore in the search engines in the near future.
In addition a technical solution was needed so that the “thank you” page couldn’t be accessed without a successful form submit.
But how to still gather accurate data for the past?
Step 6: Set up a segment to exclude direct entrances on the “thank you” page.
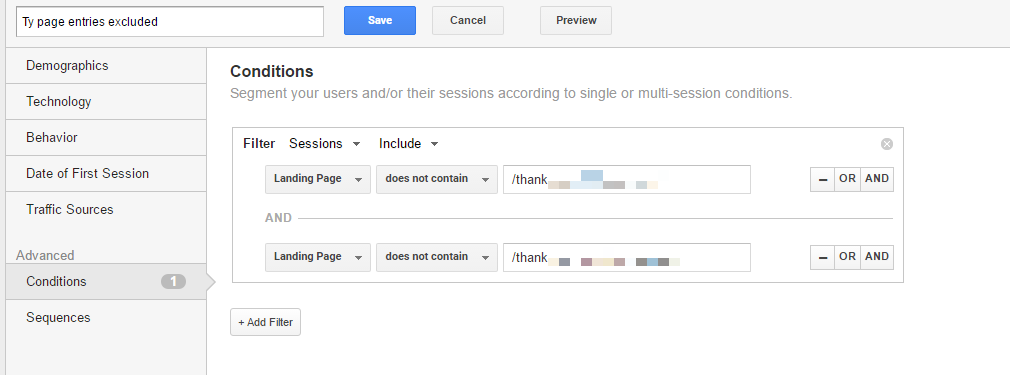 Step 7: Add segment to Supermetrics’ automated report. So that there reporting data wasn’t skewed.
This entire approach has helped me to:
- Narrow down the issue.
- Find solutions to the actual issue.
- Implement a temporary fix in their reporting.
There are other solutions to retrieve this information. However, the goal reverse path report provides a lot more context to approach and solve a goal conversion issue like this.
2. Bring Context to Conversion
In one of my recent Analytics audits I had to deal with an “Ajax” website.
This company had a measurement challenge because of their current structure: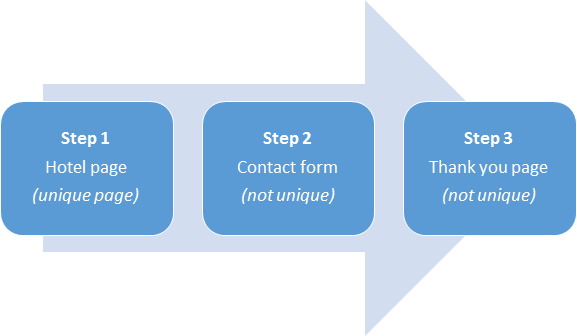 European luxury travel site:
- Unique hotel page
- Contact form not unique
- Thank you page not unique
Challenge
There was no appropriate tracking in place and the structure lacked to directly use the content reports to reveal the best converting hotels.
They simply could identify how many contact forms were submitted and that was it. The back-end data revealed some more details but they couldn’t tie it back to on-site behavior.
Besides working on a fix for tracking the right stuff, they asked me help demystify historical data that could already help them now instead of in the future.
Solution
I could use the Google Analytics API and work with different “next page path” reports.
But in this case I preferred to use the reverse goal path report in Google Analytics.
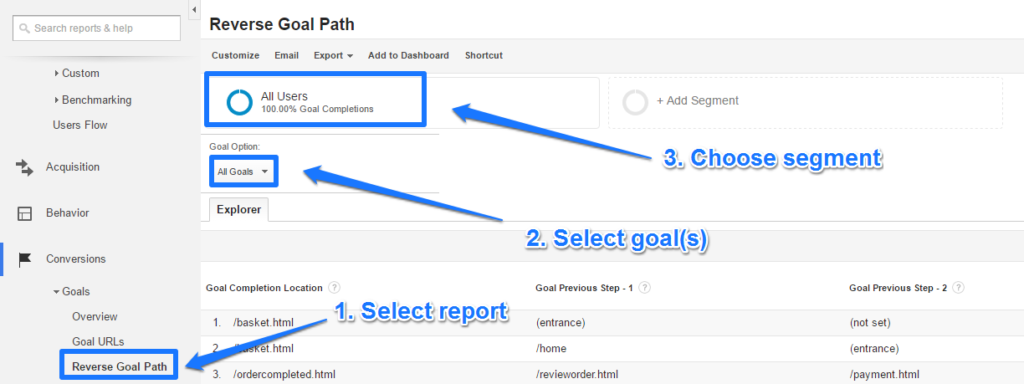
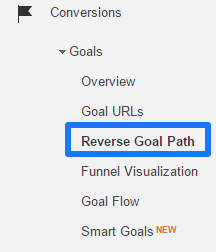
Step 1: navigate to reverse goal path report (Conversions >> Goals >> Reverse Goal Path).
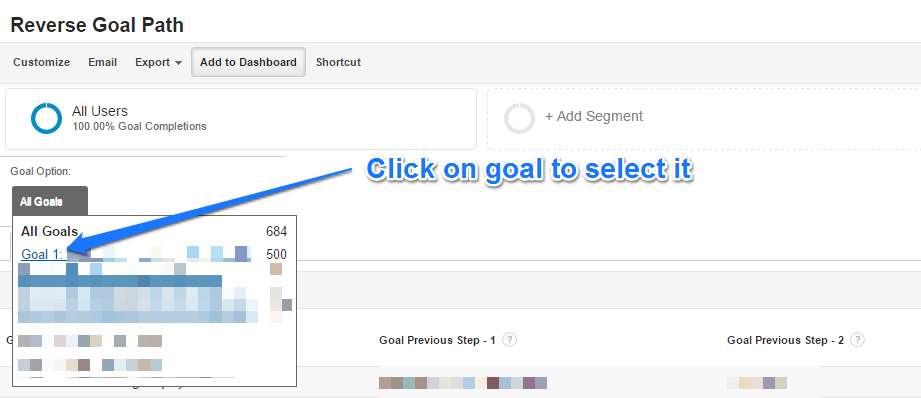
Step 2: select specific, involved goal.
Google Analytics shows all goals in the default settings. It is much more easy to select just one goal if you want to analyze on one specific conversion.
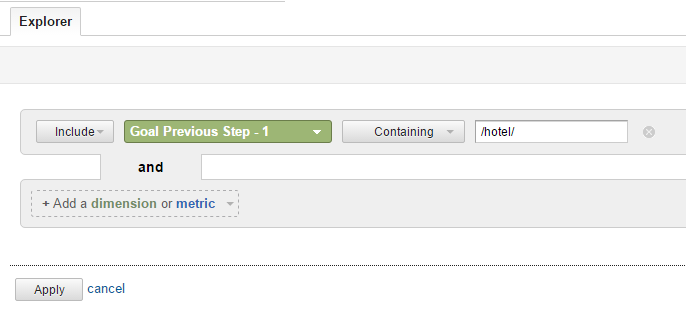
Step 3: set up an advanced filter to narrow down on goal previous step 1 = hotel page.
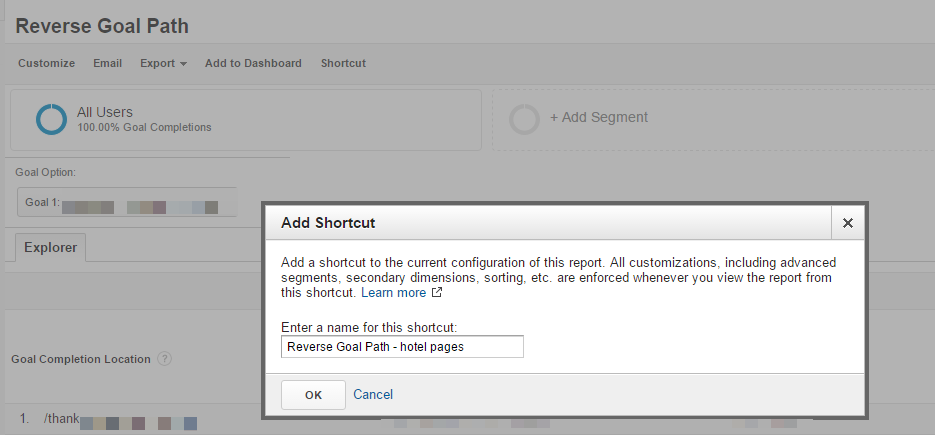
 Step 4: save all settings as a Shortcut.
Report shortcuts are very useful, especially if you work with “advanced” reports that you want to select again in a future session.
 You can retrieve the shortcut easily via:
- The navigation bar on the left side (under “Dashboards”).
- The search field in the top left corner.
- In the admin section (under “Personal Tools & Assets”). In this section you can access, view, rename or delete any shortcut.
Step 5: export conversion numbers and hotel information to Google Sheets.
Step 6: use some formulas to aggregate the data on hotel name.
Step 7: inteprete data and inform client.
By now I knew the exact paths (hotel pages) people saw before they submitted the contact form. In addition I have done several analysis to reveal many more actionable insights:
- Segmenting the goal conversion paths for demystifying important conversion segments.
- Use the dimensions & metrics explorer to build in some automizations.
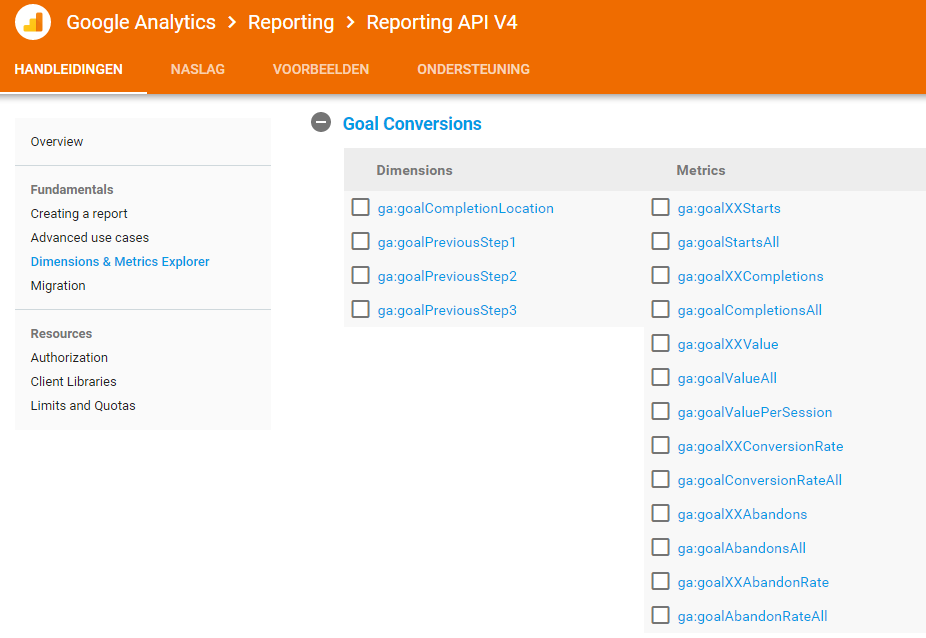 I have also written an extensive guide on using metrics and dimensions. Make sure to read it as well!
You can replicate this process for your situation. Although it might be a bit different, you can probably use the same strategies.
3. Map Out Different Conversion Paths
A few weeks ago I wrote an in-depth post on how to use the fantastic Google Analytics Demo Account to enhance your Analytics learning.
There is one last thing related to the goal reverse path I want to share with you.
You can exactly replicate my steps if you have already access to this account.
Step 1: navigate to GA account Google Merchandise Store.
Step 2: open the “master view”.
Step 3: select the month July (2016).
Step 4: navigate to Conversions >> Goals >> Reverse Goal Path.
Step 5: select “Goal 4: Entered Checkout”.
Step 6: identify main “basket conversion paths”.
Here is the data of July 2016:
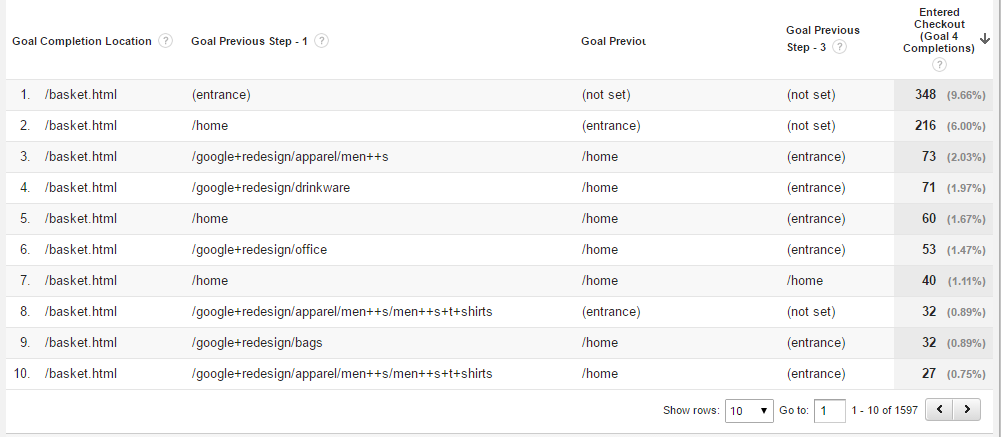 Six insights at a glance:
- In 10% of the sessions the basket page is the entry page on the website. Returning visitors / retargeting campaign?
- High percentage of sessions where a visit to the homepage leads to the basket page.
- Apparel men is (one of) the most popular product category.
- There are many determined website visitors. They need just a few pageviews before they arrive on the basket page.
- Top 10 goal completion paths account for 25% of the sessions where the basket page is reached.
- Huge longtail of conversion paths (in total there are 1.597 goal conversion paths identified).
Even a plain often-overlooked report can tell you a lot! You just have to know how to make the data useful and tie it to your business questions.
I hope you have picked up a few new ideas here.
Happy to hear your comments! Do you already use the reverse goal path reports in Google Analytics and how? If not, make sure to start using it today!
One last thing... Make sure to get my automated Google Analytics 4 Audit Tool. It contains 30 key health checks on the GA4 Setup.
Could you please share how to create custom report where Reverse Goal Path Report show more than 3 previous steps?
Hi! Unfortunately this is not possible as there are only three dimensions available to build this report: ga:goalPreviousStep1, ga:goalPreviousStep2 and ga:goalPreviousStep3. You would need to come up with a different solution for this.
Hi! I think you’ve solved something big that I couldn’t figure in you solution #1! Thank you!
Could you please elaborate how to do “Step 4: Cross-segment direct entries on traffic source and user type.”? I don’t seem to have access to the ability to pull out the “Source” and “User Type” when looking at the Reverse Goal Path Report – how did you do that? Thank you once again!
Hi Claire,
Thanks for your comment!
Actually, I didn’t directly pull out “Source” and “User Type”. This is done by adding segments to the report.
Learn more: https://online-metrics.com/google-analytics-segments/.
Hope that helps!
Hey Paul,
do you think it’s useful and even possible to have page data for each step?
for example, for each page in goal – previous step 3, we would see bounce rate and sessions
Hi Luca,
Not sure what you are trying to accomplish, but I believe this is not possible.
Also, make sure to not match session-level metrics with hit-level dimensions and vice versa. Sessions don’t match with page.
Best,
Paul
Hey Paul,
I filtered this report by Organic Traffic (Google’s predefined segment) and I’m seeing something odd. Aside from the top 2 paths, all of the goal completion numbers are the exact same, even across different Goal Completion Locations. Do you know what would cause this?
Thanks in advance,
Ryan
Hi Ryan,
Thank you for your message. To be honest, not sure what is causing this, haven’t seen it before.
Maybe it is related to how you are pulling the data out of GA. The third tab doesn’t show these stats in that way. Have you replicated this report inside of GA and do you see the same over there?
Best,
Paul