Implementing Enhanced Ecommerce is just the start. Asking the right questions is key to generate insights that drive change. This is crucial if you are running an ecommerce shop.
Digital Analytics isn’t easy. There are a ton of things that could go wrong:
- You don’t have a concise measurement plan.
- You have incorrectly implemented the tool.
- You haven’t asked the right questions before analyzing the data.
- You didn’t test your findings.
- You misinterprete the data.
Oh boy, this list could be much longer actually.
In this post I am going to reveal 33 questions and answers that help you to measure and optimize your ecommerce performance in a much better way!
To be able to follow along, I recommend to get access to an account where Enhanced Ecommerce is implemented.
The Google Analytics Demo Account is perfectly suitable for this matter.
Table of Contents
- Product Analysis
- Search Analysis
- Promotions Analysis
- Category Analysis
- Funnel Analysis
- Purchase Analysis
- Attribution Analysis
- Post-Purchase Analysis
- Concluding Thoughts
Enhanced Ecommerce Product Analysis
The first category of questions are related to your products and their individual performance.
1. What products are most popular?
Navigate to:
Conversions >> Ecommerce >> Product Performance
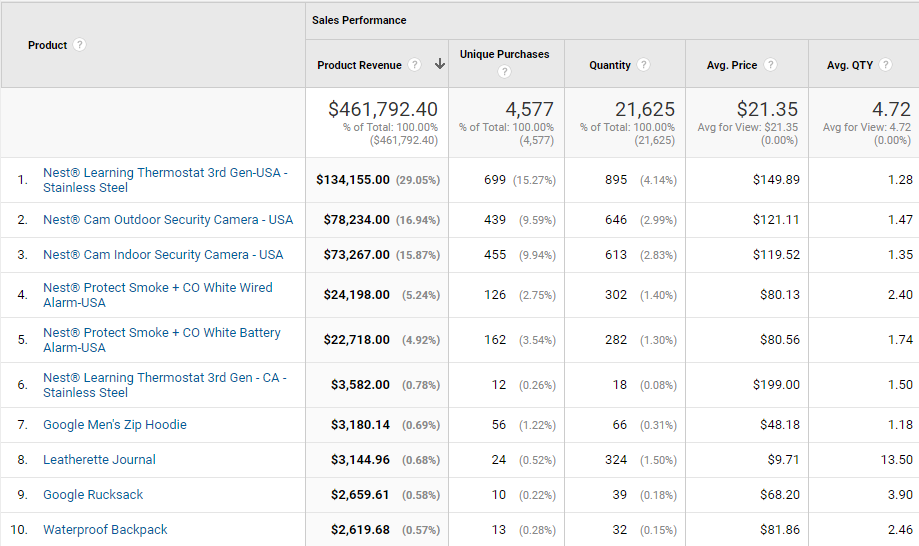
This Enhanced Ecommerce report will quickly show which products attribute the most to your total revenue. In this case 5 out of 357 products are responsible for 70% of total revenue! That is huge and could be a potential risk.
2. What product sizes should be bought extra in the next season?
Google’s Merchandise Store doesn’t log anything related to “product size”.
However, this could be a valid custom dimension on your website if you sell products in different sizes.
You can add it as a secondary dimension to your product performance report or you could build a custom report:
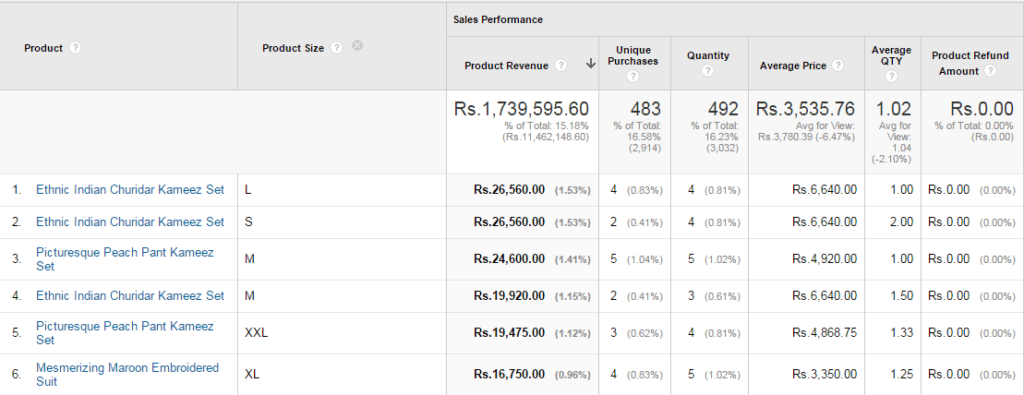 This information is critical for product development. Which products do people view and buy and from which sizes? It could definitely help to create a better offering for your customers.
3. What products have the highest Cart-to-Detail Rate?
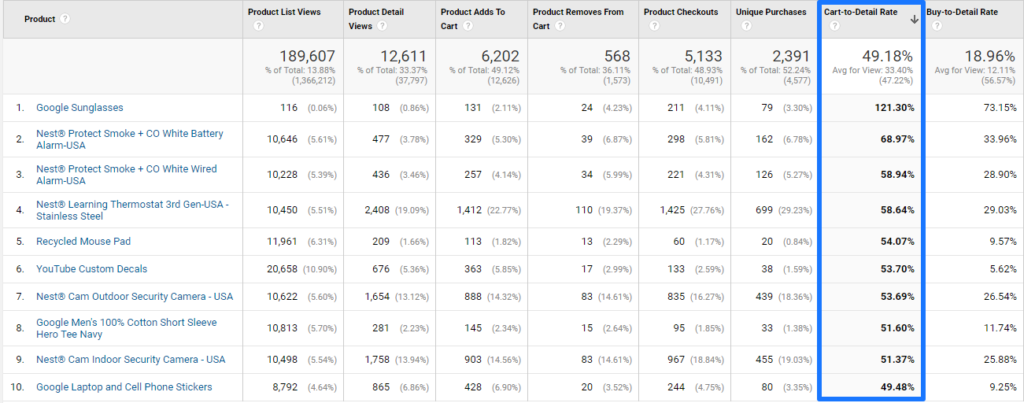
Quite interesting, “Google Sunglasses” has a Cart-to-Detail Rate that exceeds 100%! Some people probably have hit the add-to-cart button multiple times on a single page.
Learning more about this rate and your products, can reveal which factors are crucial in making a product (and price) attractive to your customers. Of course there is nothing more valuable than asking your customers these type of questions as well.
4. What products have the highest Buy-to-Detail Rate?
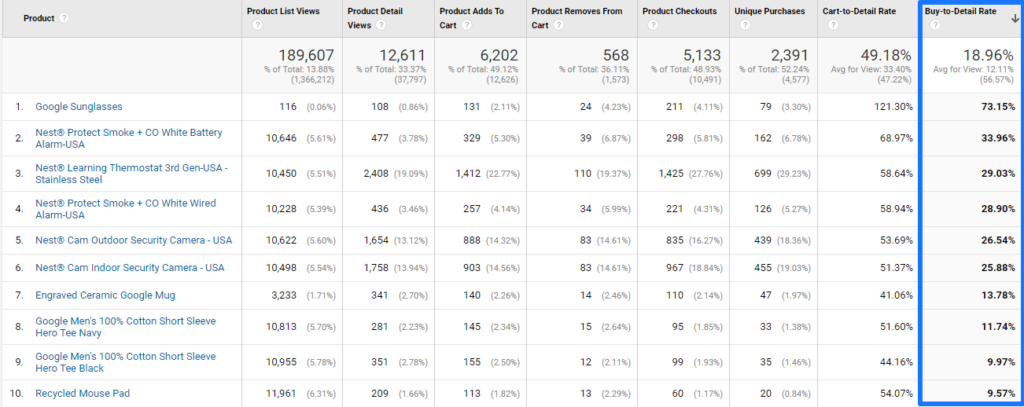 Not very surprising, “Google Sunglasses” scores the highest on this metric as well. Often there is a strong correlation between these two metrics.
This Enhanced Ecommerce metric can deliver great insights around the shopping behavior focused on different products. Sometimes if can be valuable to define a calculated metric to analyze both metrics at the same time.
5. What products have a negative remove/add to cart rate?
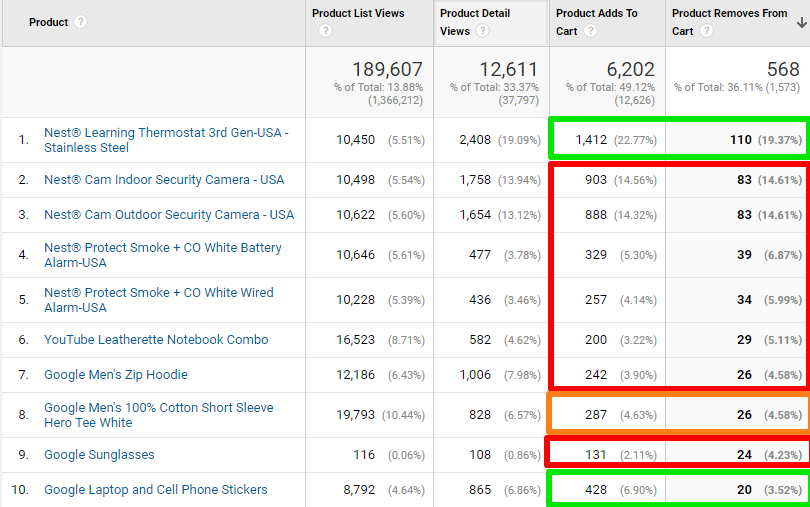 Enhanced Ecommerce allows you to analyze your “add to cart” and “remove from cart” values in multiple ways.
You could look at different things:
- Cart-to-Detail rate.
- Add to Cart raw number.
- Remove from Cart raw number.
- Remove / Add to Cart rate.
- Relative number of Remove from Cart compared to total number of Add to Cart.
Search Analysis
The internal site search can be very effective in converting visitors into customers.
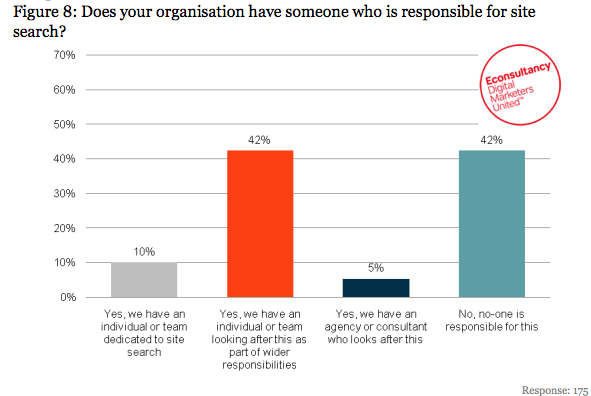
Unfortunately a study from eConsultancy has shown that many companies don’t have the resources in place to properly optimize their site search functionality.
 6. What is the difference between search and non-search conversion rate?
Here is one example of search vs non-search conversion rate:
 In this case (a small retailer) in one month site search is used in / responsible for:
- 11% of all sessions.
- Ecommerce conversion rate of 1,51% (vs 0,59% in visits without site search).
- € 1,35 session value (vs € 0,82 in visits without site search).
These metrics indicate that people who use site search are much more likely to convert. Keep in mind this could both indicate correlation as well as causation.
In addition, Sessions with Site Search show a lower than average order value. It could be the case that most buyers from search are very much determined to buy one specific product instead of just shopping around.
In all cases, if site search is an important functionality on your website, you should ensure to optimize it.
All too often I have to deal with sites that offer a very bad site search experience. Read this Baymard site search guide to learn more about site search and usability guidelines and improve search on your website.
7. What are the most fruitful product searches?
This analysis only makes sense if you have a decent amount of product search data.
Here are a few rules to make this analysis effective:
- Analyze a period of at least a few months of data.
- Filter on “product search” terms.
- Include only “product searches” with at least a few hundred searches.
- If possible aggregate same-like terms.
- Sort your “product search” terms on Ecommerce conversion rate.
These are the statistics of a large international Retailer:
(Report: Behavior >> Site Search >> Site Terms)
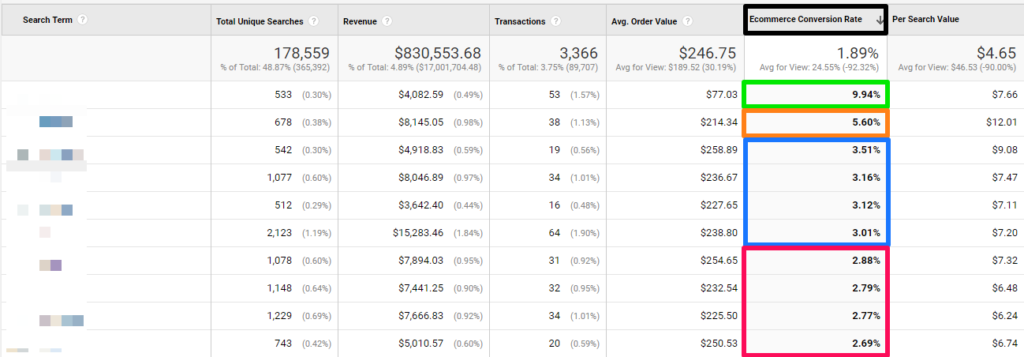
At a glance you can see one term has a very high conversion rate compared to the other searches. However, if you look at the details, you will see that this term has a lower than average order value which negatively impacts the value per search.
Keep in mind that you should always analyze your metrics (e.g. Ecommerce conversion rate) in context. You can do this by looking at specific time periods, making a comparison with other metrics or applying segmentation in Google Analytics.
8. What searches reveal new product opportunities in your future assortment?
What if a lot of people search for related products to your current assortment that you are not offering yet?
Make sure to analyze the top search queries on your website so that you can optimize your navigation structure, content and assortment based on your visitors needs.
You will be astonished how much you can learn from your visitors’ searches!
Promotions Analysis
9. What promotions generate the most (extra) revenue?
There are multiple ways to analyze the impact of internal promotions on revenue metrics.
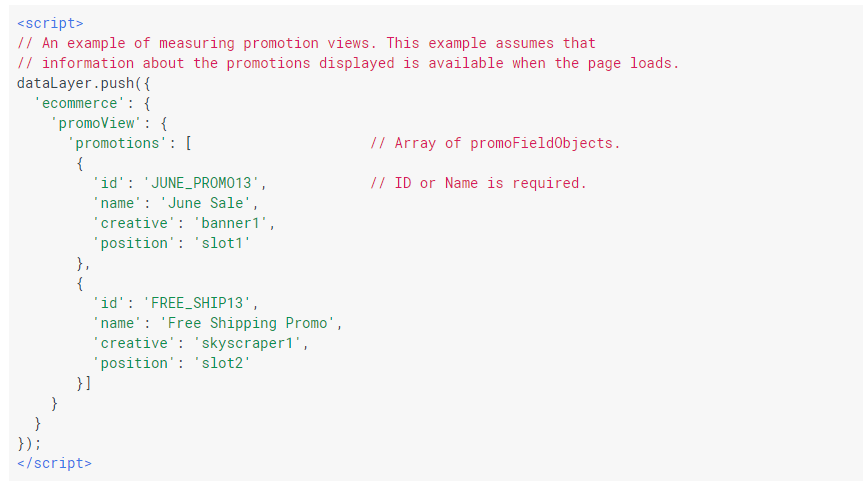
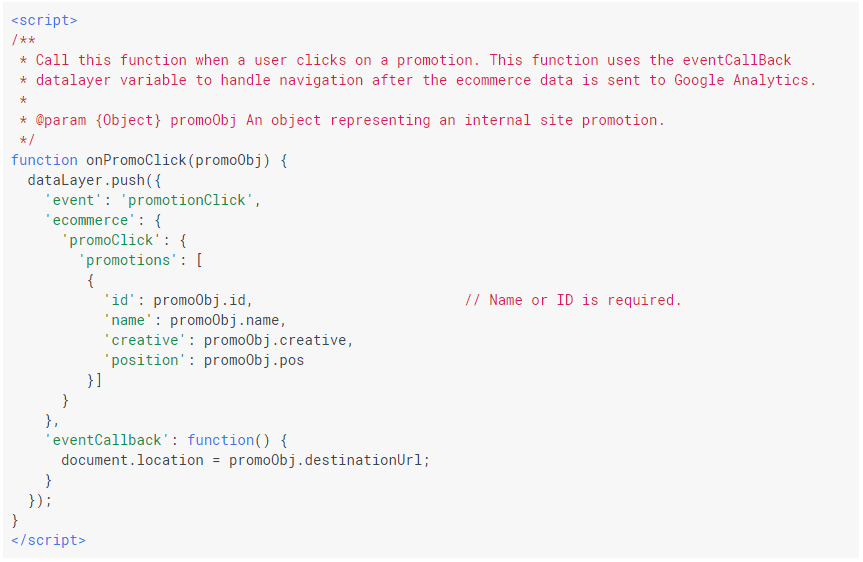
First of all you need to implement Enhanced Ecommerce in the correct way.
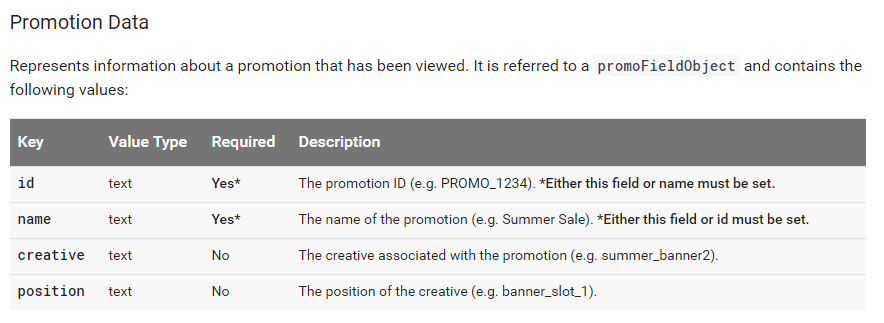 Here you can find more information about Tag Manager and code examples.
Measuring Promotion Impressions
Measuring Promotion Clicks
I assume you have installed Enhanced Ecommerce on your site or you can look at the Google Merchandise Store.
Navigate to: Conversions >> Ecommerce >> Marketing >> Internal Promotion.
Let’s look at one of them: the “Internal Promotion” report.
(I have filtered on all data in 2016)
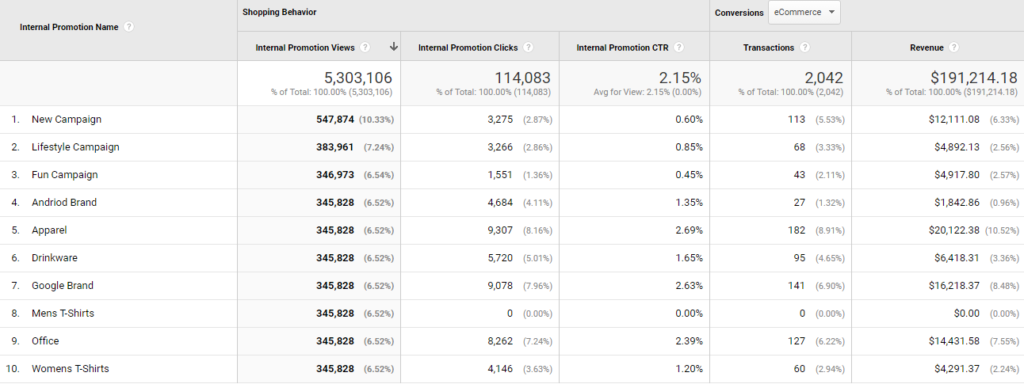 First of all, these numbers don’t look very trustworthy. But this gives a great first idea on what you can accomplish with this report.
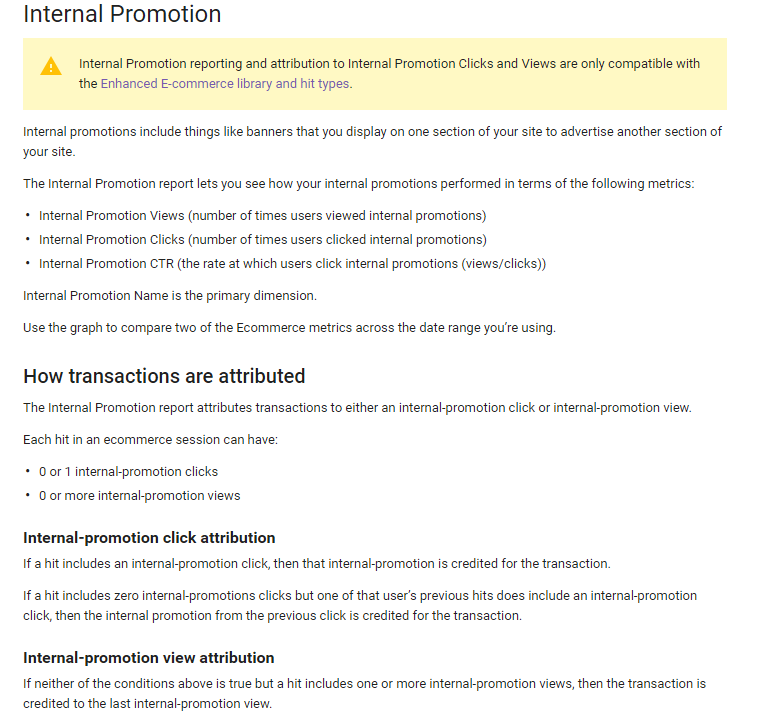
10. What is the effect of promotions on products without promotional discounts?
The next interesting part would be to examine the effect of running promotions in one category on the sales in a different category.
Here are a few thoughts:
- The effect of promotions in one category will probably most impact closely related categories. However this could go in two directions:
- Why buy the other product if there is no discounted offer?
- Why not buy the other, additional product if you have already saved some money?
- The effect of promotions in one “mini-shop” – with big differences – in relation to other categories, probably won’t have such a big impact.
This is when psychology and segmentation becomes really important.
You can set up Google Analytics segments to find out more about:
The more browsers and customers who stay in the same category, the smaller the impact in general.
11. What promotions should I always offer?
Let’s assume you find out that offering free shipping on orders above $99 positively effects your revenue numbers and bottom line.
You might have a lot of recurring customers who are used to see this offer. Changing it one day could greatly affect your customers and especially the ones who already know you for a time.
So you could decide to always offer this “free shipping” promotion. This is not category based in most cases.
On the other hand – and more category based – you could always offer promotions on “older” products (that will be replaced soon).
You will still need to analyze your numbers:
- How does it impact my total revenue and margin?
- How does it impact my new product line?
12. What promotions should I never offer again?
Of course, it’s obvious if a discount doesn’t lead to more happy customers and/or more sales, it doesn’t make sense to offer it again.
However, there are more factors that make or break a promotion. Think about the timing of the promotion, your competition etc.
You should think about different scenario’s and how you would act on different outcomes. A solid strategy and marketing planning are key here.
13. Do promotions have a net positive or negative impact on the business?
Offering promotions (via external website / affiliates) or directly on your site can greatly increase your revenue numbers.
On the other hand, if these promotions don’t impact your bottom line, you might change your point of view towards them.
Google Analytics works great to capture revenue numbers, but if you want to incorporate margins and other metrics you might want to make an external analysis as well.
Enhanced Ecommerce offers a lot, but sometimes you want to use different tools and modules to get the best picture of what’s working and what’s not.
Be careful with sending sensitive information (like product margin) to Google Analytics. You might want to use the data import functionality so that this information is not revealed to competitors who might debug your Analytics.
Category Analysis
The majority of Ecommerce store owners have divided their products in multiple categories. Knowing all about the performance of each category is crucial in terms of optimization.
14. What category generates the most revenue?
It’s very important to understand how each category attributes to your stores’ revenue.
Here is an example of the Google Merchandise Store:
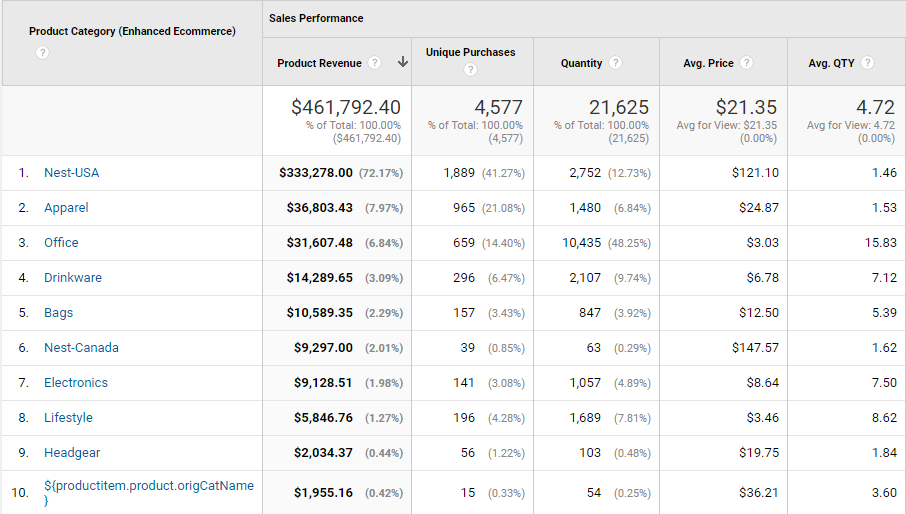
In this case Nest-USA is responsible for more than 70% of total revenue. This percentage is very high especially because of the higher than average price of products sold in this category.
You can even go deeper here if you use the extended product category rules in Enhanced Ecommerce.
15. What categories are the most popular?
You can measure popularity in different ways.
Let’s keep it “purchase” oriented for now and focus on quantity sold:
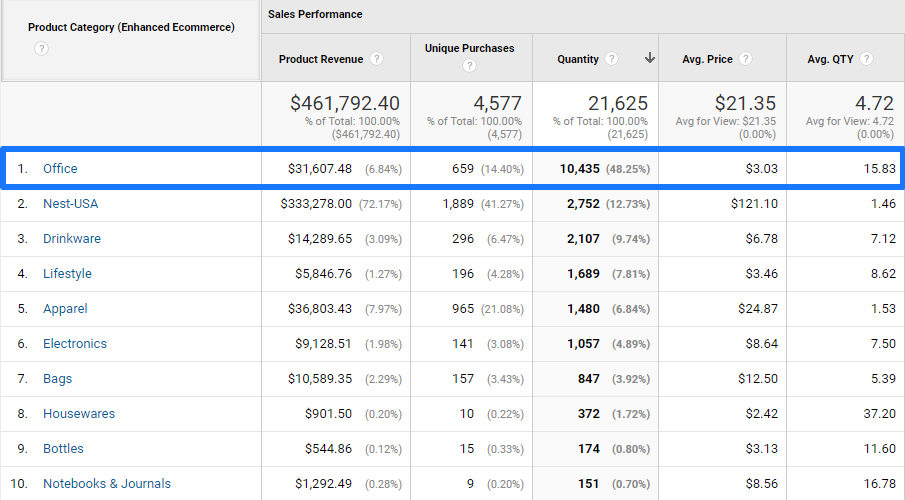 Office category products contribute to 7% of total revenue and 48% of total products sold. Probably they have a relatively small contribution to the bottom line, but Office products are generic and popular in general.
16. What categories are the least popular?
On the other hand there are categories that aren’t popular at all. In the Google Merchandise Store it looks like this (I have filtered on product categories with at least one item sold):
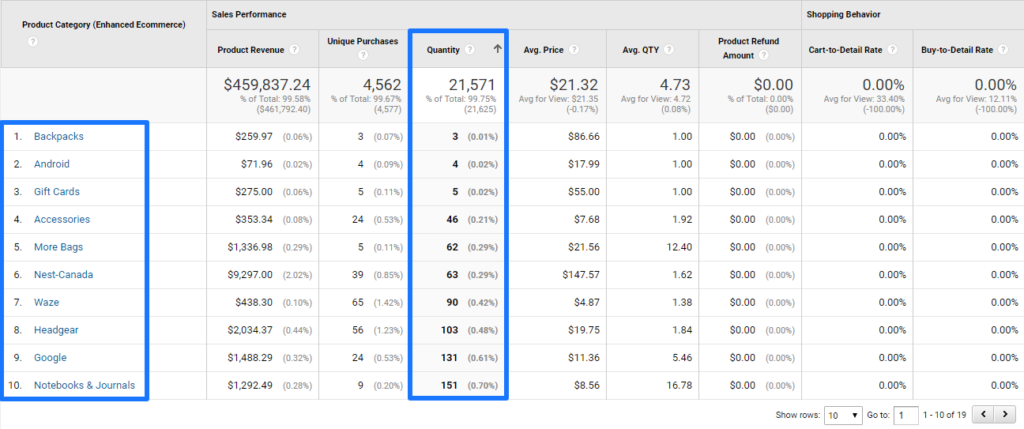 Here are the numbers:
- 10 out of 19 categories are responsible for 3% of total items sold.
- These categories contribute less than 4% to total revenue.
It’s very important to weigh these numbers against assortment, category attractiveness and visits and merchandise plans.
17. Do people show interest in one or multiple categories?
The first few questions are really basic. You need to apply segments in Google Analytics to answer some of the more advanced queries and questions in your organization.
To keep things a bit easy, I will use session-level segmentation.
First of all I want to learn more about the distribution of landing pages across product categories. Good to see they have set up content groupings.
Step 1: Navigate to Behavior >> Site Content >> Landing Pages
Step 2: Select Content Grouping: Product Categories (Landing Content Group)
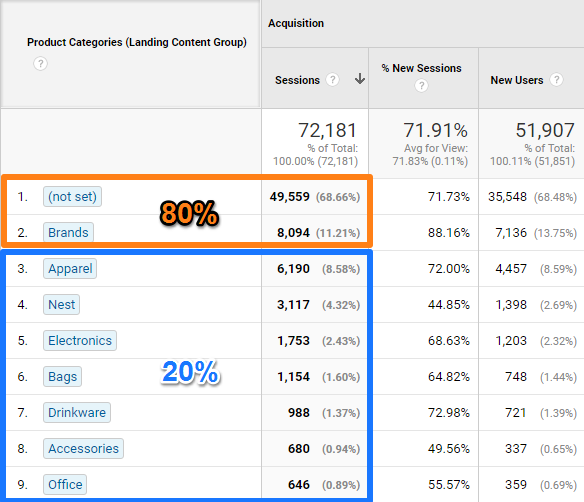 This is a crucial first step, because a majority of entrances within one specific product category would possibly skew the analysis. And could force me to take a different approach. In this case the numbers look fine.
Now I need to find out more about the attractiveness of categories independent of whether it is an entry or not:
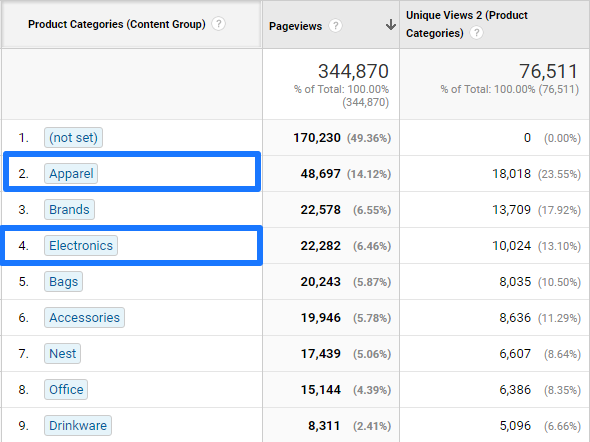
Apparel and Electronis are the most popular ((not set) and brands excluded).
Three questions to dive deeper:
1. What percentage of sessions contain a pageview in the Apparel category?
2. What percentage of sessions contain a pageview in both the Apparel and Electronics category?
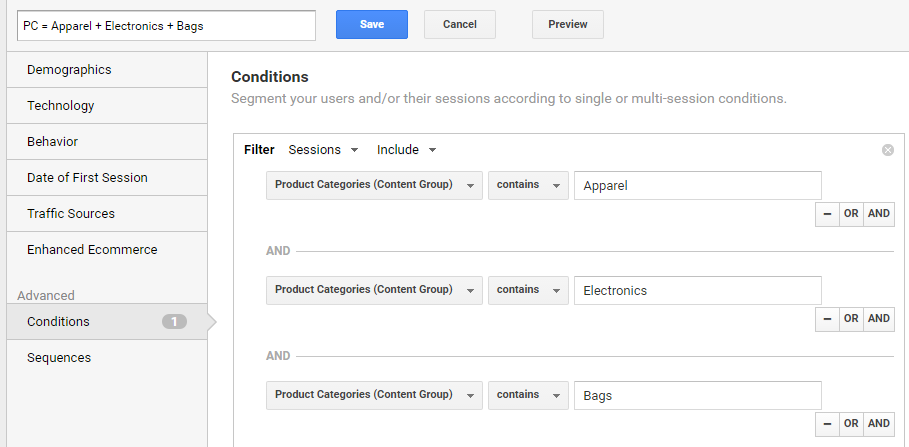
2. What percentage of sessions contain a pageview in both the Apparel, Electronics and Bags category?
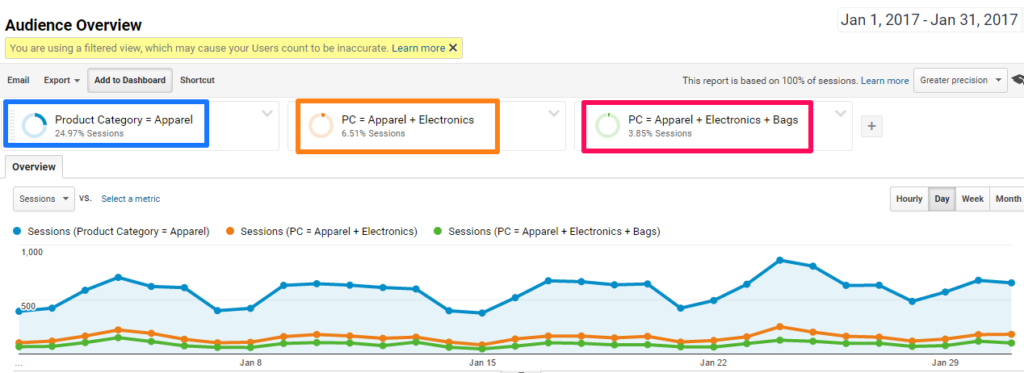
Here are the results:
- PC = Apparel (24,97%).
- PC = Apparel + Electronics (6,51%).
- PC = Apparel + Electronics + Bags (3,85%).
This analysis can reveal a ton about the navigational behavior and “mini-shop” interest of your visitors.
Here is a screenshot of how to set up the last segment (you can do the other two easily by yourself):
18. Do people buy from one or multiple categories?
Of course you could manually go through all your transactions to find out all about the buying behavior of your visitors.
But we both know better right!
I recommend to use both Google Analytics and an external system to easily gather the desired data.
In the Google Merchandise Store example we already discovered that Nest-USA is responsible for over 70% of all revenue.
Example of questions to ask:
1. How many transactions include at least one product from the Nest-USA product category?
2. What are the most popular categories that are bought together with Nest-USA products?
 Here is what we can learn:
- Around 2/3 of all transactions contain a product from the Nest-USA category.
- Revenue generate by this group is 74% of total revenue.
- -(($ 333278 – $ 341887) / ($ 341887)) * 100% = 2,5% is total revenue in this segment from other products.
Now let’s review the revenue stats Enhanced Ecommerce report and exclude Nest-USA.
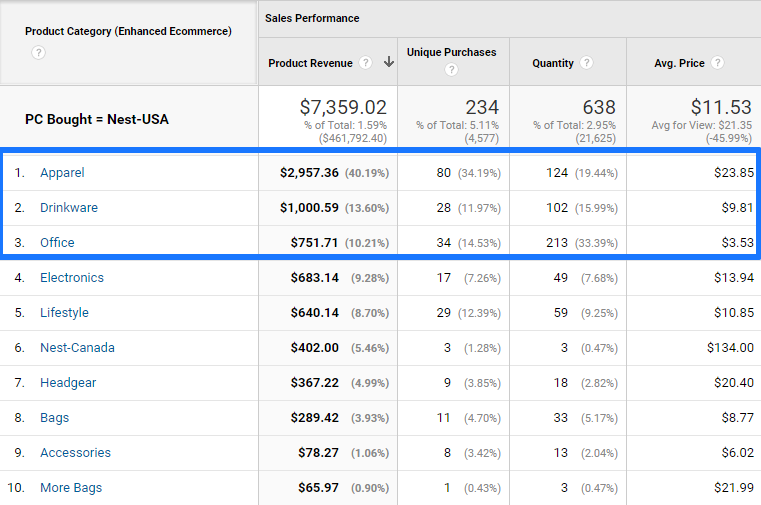 And we have a clear winner:
- Apparel is the most popular.
- Apparel, Drinkware and Office products are most frequently bought together with Nest-USA products.
I hope by now you realize how powerful these Google Analytics segments are! Segmentation is one of the crucial skills to master.
19. What categories will be popular the next year?
Based on category sales (per period in year and trend in last months), you can estimate category performance for the next year.
Sit together with your Merchandise team and make a plan for the next year that greatly benefits your visitors and your company.
Note: you could repeat the same exercises shown in this chapter for brands if you offer multiple brands on your website.
Funnel Analysis
The buying funnel on an Ecommerce site is usually quite straightforward.
- Someone is interested in buying a specific product (or has a clue about the type of product she desires to buy).
- A couple of websites and products are compared.
- One or more products are added to the basket.
- Ka-ching, the visitors checks out and buys!
Is it really that simple? Not really, very often the path to purchase is not entirely linear and it might take multiple sessions for a visitor to finally convert.
It depends on the state of mind of the customer and the complexity of the purchase. And a lof of more factors are involved.
20. Is the sequence of steps on my ecommerce site as expected?
There are different techniques to analyze sequential behavior on your site.
Here are just a few of them:
- Analyze session-based sequential segments.
- Analyze user-based sequential segments.
- Analyze the navigational summary report.
- Analyze the behavior flow analysis report.
- Analyze the users flow report.
- Analyze the goal funnel report.
- Analyze the checkout behavior report.
- Analyze the shopping behavior report.
Unfortunately a very small percentage of people really understands which report to use and when. And what are the drawbacks on each. It’s confusing!
Let me share a bit more about session-based sequential segments and the complexity involved.
Before setting up any segment you need to know about all details on the site structure. This can greatly vary from site to site.
For example, on the Google Merchandise Store site, people can choose to add a product to basket from a category page or product detail page.
- Visit product category page -> add product to basket -> place order.
- Visit product category page -> compare three products -> go to product detail page of one product -> add to basket -> place order.
You could say that a visitor replicating path one knows what she wants and a visitors replicating path two is still in “comparing mode” before deciding to buy or not.
Analyzing segments is crucial if you want to better understand the behavior and decision factors of your customers.
Here is an example:
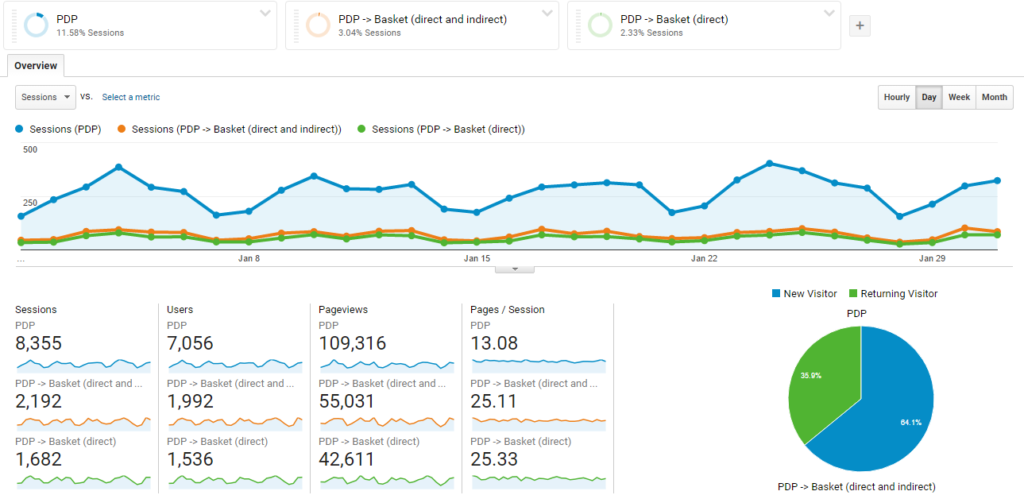
Three segments are compared:
- Sessions with PDP visited. (11,6% of all sessions)
- Sessions with PDP visited and direct/indirect visit on basket page. (3,0% of all sessions)
- Sessions with PDP visited and direct click to basket page. (2,3% of all sessions)
For which segment do you expect the highest conversion rate?
I will first show you how to build each segment.
Segment 1

Segment 2
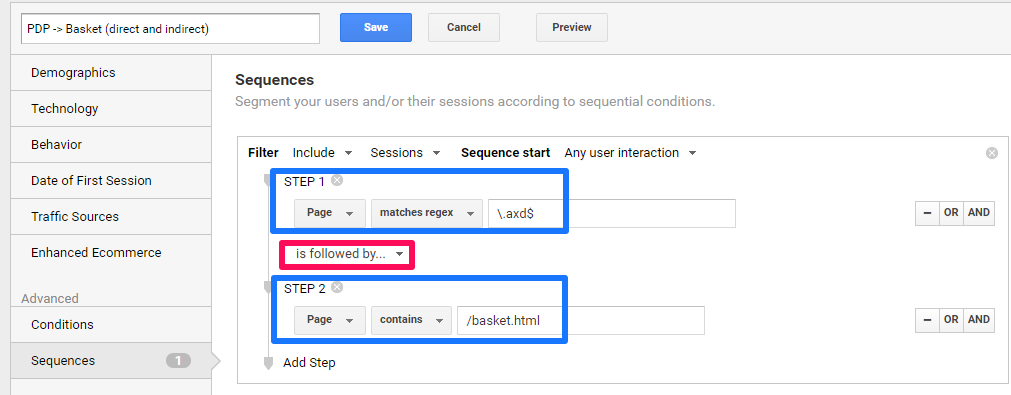
Segment 3
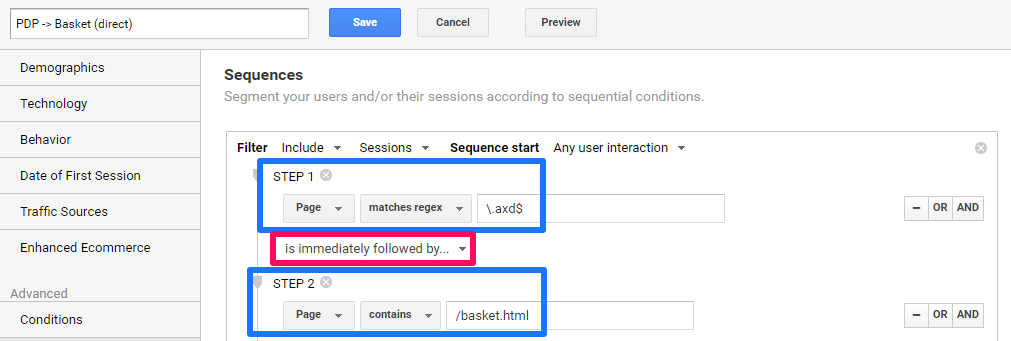
And the results are…
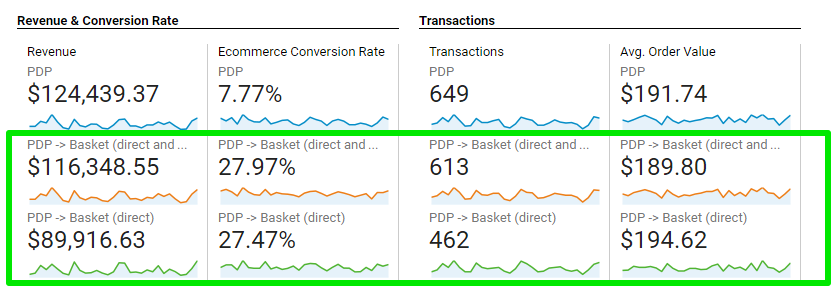 As expected the PDP/Basket segments perform better, but would you expect a difference between segment two and three?
Make sure to define your question as clearly as possible and then try to come up with the best fitting analysis. This isn’t easy, but you will get better at it once you have tried and compared different analysis methods.
21. Where do most people drop of in my purchase funnel?
Again, you could use multiple different analysis techniques to answer this question.
Some of the Enhanced Ecommerce reports have their drawbacks because they are hit based.
In this example we will look at the unsegmented goal funnel report:
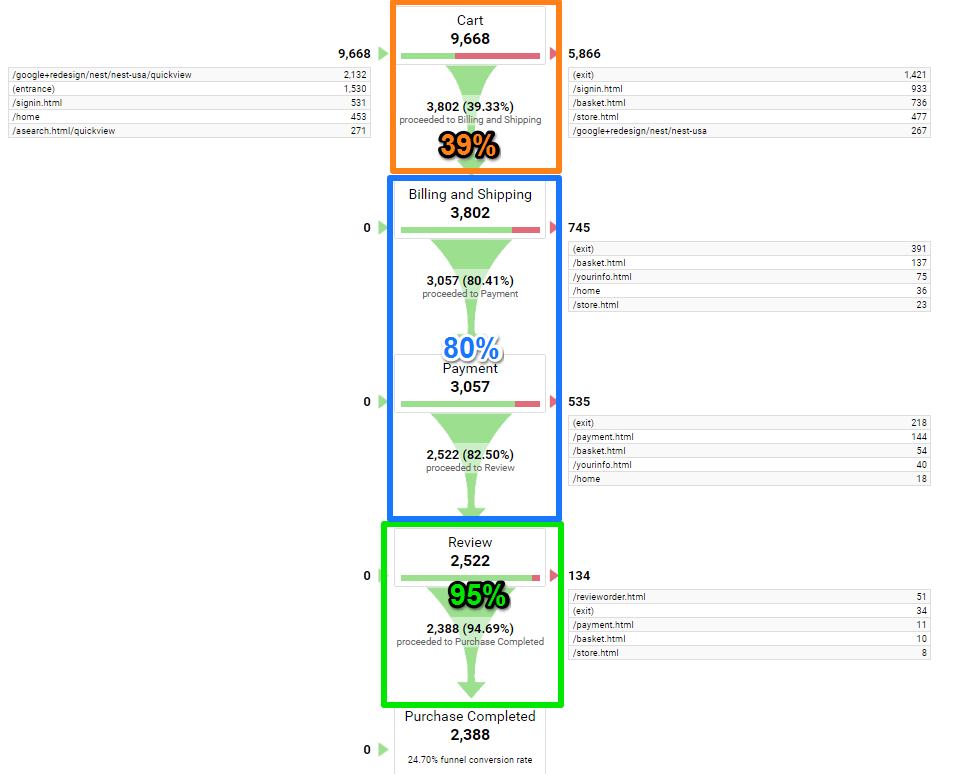 As expected, the largest drop-off occurs on the basket page.
- What can be done to improve the percentage of people that add a product to basket?
- What can be done to improve the flow from basket to purchase?
These and other questions needs to be examined in more depth. You will need both quantitative as well as qualitative data and run multiple (AB) tests to find out.
22. Is there a difference in drop-off between new and returning visitors?
Segmented analysis is – as you know by now – key to finding actionable insights and improving your conversion.
In the past I have explained about setting up horizontal funnels to analyze each funnel step on a segmented level.
However, you can use a different report as well if you have implemented Enhanced Ecommerce .
Let’s take a look the shopping behavior report:
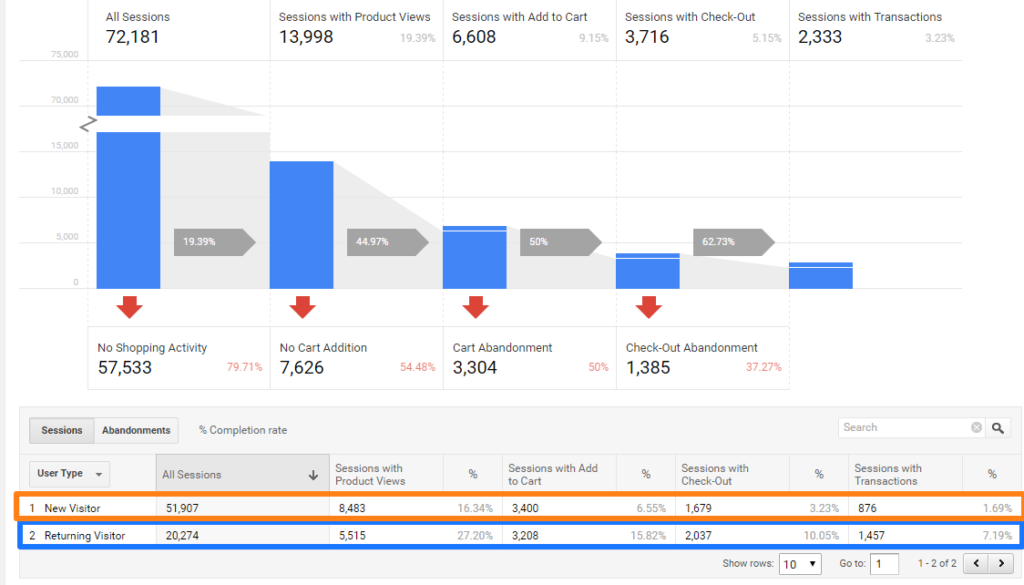 In this case Returning Visitors seem to perform better overall. This is not unsual to see.
However, take into account that:
- Users can reenter the funnel at any stage; for example, if a user added something to the cart during one session, and then came back to complete the purchase in a subsequent session, the funnel visualization would count the user as reentering at the Checkout step.
- Percentages are calculated based on All Sessions; for example, 6,55% (Sessions with Add to Cart – New Visitor) is calculated as 3400 / 51907 * 100%. You have to calulate “flow percentages” (from step-to-step) by yourself.
23. Is there a difference in drop-off between devices categories?
We can use the same report and change “User Type” to “Device Category” to retrieve these numbers:
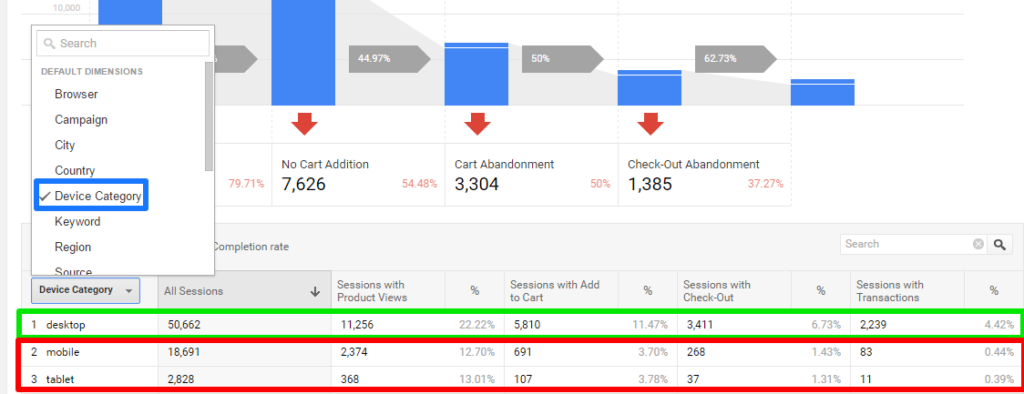
Numbers indicate:
- Desktop traffic converts the best by far.
- Drop-off on Mobile and Tablet especially high on Add-to-Cart step and just prior to conversion.
Please note that “Sessions with Product Views” can be influenced by where channels actually send the traffic (directly to PDP or other page).
Google should use this information to further investigate and optimize their funnel and checkout flow on Mobile and Tablet.
24. Is there a difference in drop-off between marketing channels?
The Enhanced Ecommerce Shopping Behavior report allows to segment on “Medium”, but not on “Channel Grouping“.
I will use a slightly different report setting now (you can directly view this report on Abandonments as well).
 The Affiliate channel is really small and very much underperforming. Especially in the checkout flow their performance is really bad. On the other hand, referral sites and direct traffic is leading in converting the most visitors.
You definitely need to segment deeper to find out what’s going on. But this report gives you a quick indication of segmented channel performance.
Purchase Analysis
25. What specific actions did customers complete compared to non-customers?
Segmentation in general can help you to distinguish between important actions on your website.
Usually we can distinguish between macro and micro goals.
- The primary goal / conversion on a website is called a “macro goal” or “macro conversion”. This can be a sale or lead for example.
- The secondary goals of a website are called “micro goals”. Think about downloading a brochure, watching a demo or asking for more information.
Once again you can use Google Analytics segments to find out what the differences are between customers and non-customers.
There are two system segments that can be useful, but I would not use them in this case:

They are defined as:
Converters:
Goal Completions > 0
Transactions > 0
Non-Converters
Goal Completions = 0
Transactions = 0
As goal completions might correlate with important micro actions on your website, these segments can ruin your Google Analytics insights.
For ecommerce sites you could use these segments:
- Sessions with transactions (system segment)
- Sessions without transactions (custom segment)
Quick example: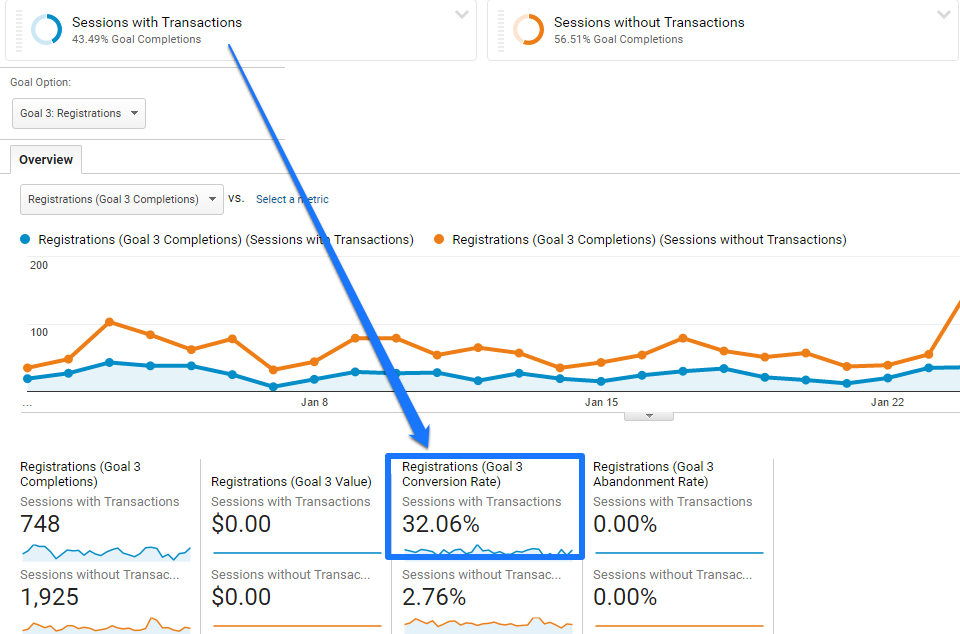
We can immediately conclude that a goal called “Registrations” is highly correlated to a purchase. This compared to a very low percentage of “Registrations” in non-buying sessions.
I know this sounds logical and it is. But imagine what you can do with these two simple segments: you can evaluate any action in relation to the main conversion on your site.
26. How many product pages are viewed prior to a purchase?
Answering this question reveals a ton about the purchase process on your website.
You can use Enhanced Ecommerce and the “product views” metrics to answer this query. Probably you can make use of a calculated metric if you have a free slot.
Another approach – if you haven’t implemented Enhanced Ecommerce – could be by segmenting on sessions with transactions and reviewing the all pages report (and PDP’s viewed).
Either way, you need to really understand segmentation and a lot of the other advanced features (e.g. regular expressions) in Google Analytics.
You could make a similar analysis to correlate the number of category or brand pages to conversion.
27. What are the most popular payment methods?
You are able to pass payment method information into Google Analytics with the help of Enhanced Ecommerce.
Here is a code example:
Attribution Analysis
Most Google Analytics conversion and transaction overviews are based on the last-click model. These reports can generate a ton of insights, but you are really missing out if you don’t take a look at attribution reporting.
28. What marketing channels initiate the most transactions?
A simple analysis can be done in just a few steps.
Step 1: Navigate to Conversions >> Multi-Channel Funnels >> Assisted Conversions.
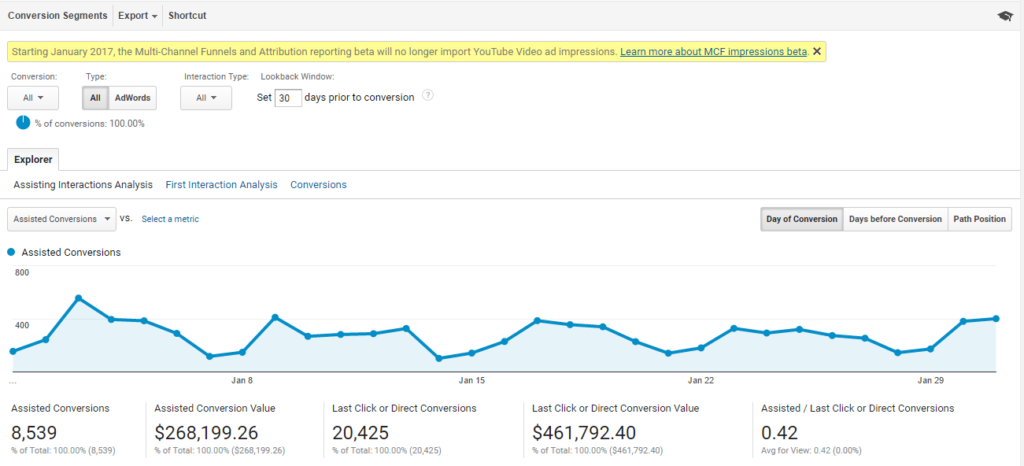 This overview is a great start, but you have to make at least one change to the settings.
Step 2: Select “Transaction” as the only Conversion Type.
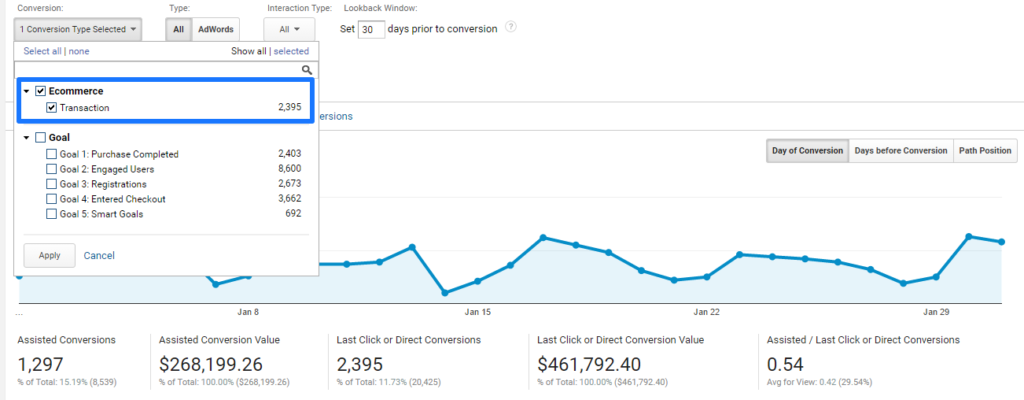
Step 3: Review the Assisted/Last Click Ratio’s.

It’s clear that the channel Display – although the numbers are low – initiate relatively the most transactions. In addition “Referrals” seem to also initiate more transactions.
29. What marketing channels close the most transactions?
The picture above reveals that Paid Search, Social, Organic Search and Direct close the most transactions.
This is a basic attribution analysis, but it can already reveal the value of some of your channels that don’t look good in the standard last-click reports.
30. What is the distribution of number of touchpoints before purchase?
Based on same device and browser (and direct traffic included) here is a quick overview:
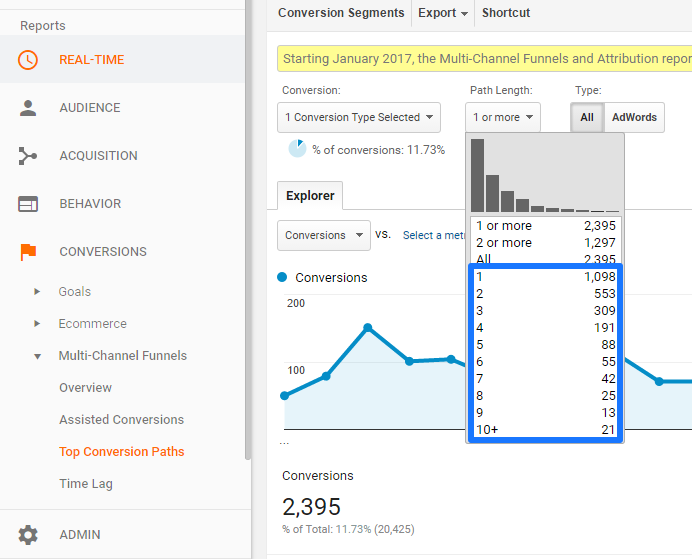 It reveals that:
- 46% of all transactions have one touchpoint.
- 23% of all transactions have two touchpoints.
- 13% of all transactions have three touchpoints.
- 18% of all transactions span over four or more touchpoints.
Most often the average number of touchpoints per transaction will be higher when:
- A transaction is deemed as more complex.
- The products are higher priced.
- The competition is more severe.
It’s your job to persuade more people to buy quicker instead of not buying at all or getting the product from one of your competitors!
The outcome of this report is probably correlated to the Time Lag report:
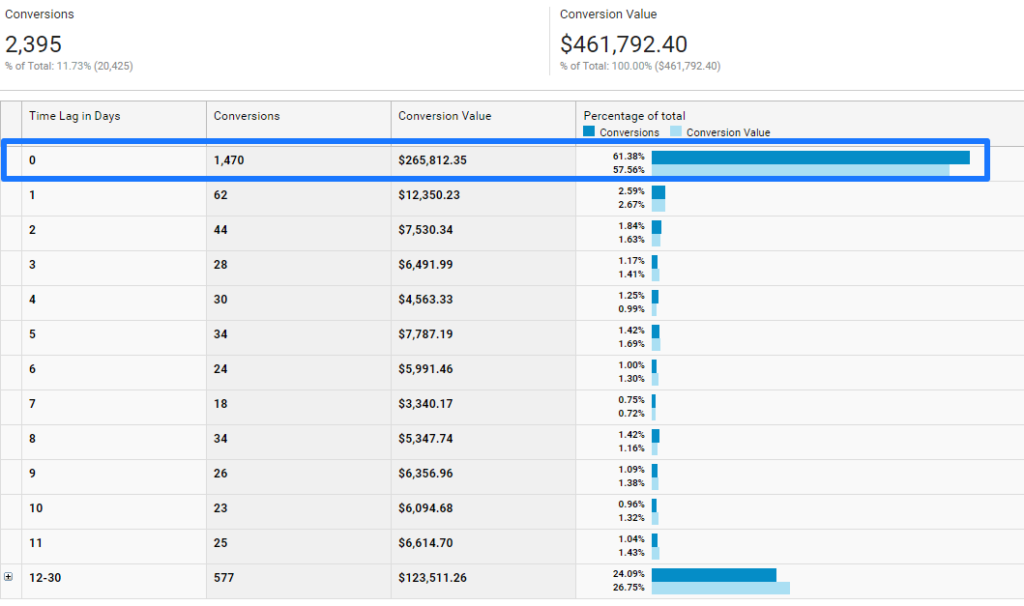 Comparing the Time Lag report with Top Conversion Paths reveals that the percentage of transactions with Time Lag equal to zero will be higher if the average number of touchpoints per transactions is relatively low.
Post-Purchase Analysis
31. What are the most common actions after ordering a product?
Many companies don’t analyze post-purchase behavior of customers on their website. And that’s a missed opportunity.
Three examples, on the confirmation page you could ask:
- What almost stopped you for buying this product?
- What has convinced you to buy this product?
- Would you like to share your purchase on Facebook (show sharing buttons)?
The next step would be to measure these actions in Google Analytics. This is easily done with event tracking.
One thing is left, sequential segmentation!
Here is an example on the share on Facebook (event label = share purchase):
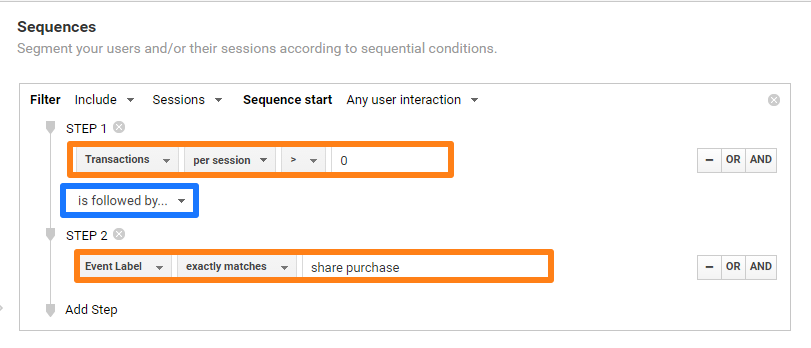 You could change is followed by in is immediately followed by if you want to analyze the segment based on first action after purchase.
Now you can compare these numbers to the sessions with transactions to find out about the relative numbers of shares on Facebook.
This method is really powerful in measuring, analyzing and optimizing post-purchase behavior! And learning a lot about your customers in general.
32. What predicted actions don’t actually occur on our site?
The prior question reveals about what customers do after they purchase. You can apply a similar analysis to find out what customers don’t do.
This is great information as it might reveal a ton of opportunities to further optimize what happens after the conversion.
33. Is there a clear pattern in actions that people undertake after ordering a product?
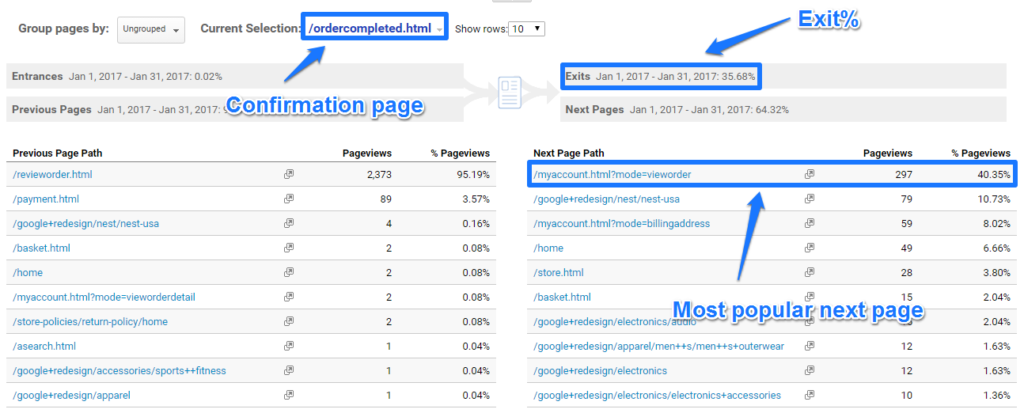
Do people go back to the homepage after a purchase or do they immediately leave the site?
Maybe they check their account or purchase information. On the page level you can use the navigation summary report to quickly find out:
Concluding Thoughts
This blogpost contains 33 relevant questions for all Ecommerce businesses on the web. And I could come up with a ton more if needed!
Further I hope it shed some light on analysis techniques that you can directly apply to your business as well.
In order to deliver growth to your company you need to:
- Ask the right questions for your business.
- Collect the best possible and reliable data, make sure to set up Enhanced Ecommerce reporting and segments (!)
- Know where to find and how to segment on the most relevant data in Google Analytics.
- Analyze the data to answer all business questions.
- Set up (A/B) tests to examine your hypothesis.
- Convey your insights with a data-driven story.
This is it from my side. Happy to hear your thoughts and comments!
One last thing... Make sure to get my automated Google Analytics 4 Audit Tool. It contains 30 key health checks on the GA4 Setup.
This is amazing! Thank you Paul!
One question – we have enhance eCommerce enabled so we can get the funnel behavior, do you also recommend to implement step by step goal settings as well?
Hi Vivian,
Thanks for the heads up. Yes, I recommend setting up goals and funnels as well. This gives you more data points and ways to optimize on your most important outcomes.
Best,
Paul
Hey,
Amazing article.
I just had one more question. Can we get the analytics for the specific products on my shopify store?
Like if I want to get details like age, gender, mobile device etc not for the whole website but for a specific or individual product only. Is that even possible with google analytics?
Apologies if it was a lame question. I am a bit new to analytics.
Thanks.
Hi Aseem,
Yes, you can get more granular (segmented) data on a more specific level, like product. There you would need to apply segmentation to your data and/or drill-down.
You can segment on age/gender, but the accuracy of your data won’t be that high anymore if you go too “deep”.
I recommend reading these articles for more info:
– https://online-metrics.com/demographic-reports/
– https://online-metrics.com/segments
Best,
Paul
This post was awesome Paul!
Thanks for providing me new analytical insights.
It could also be interesting to read a post with questions for a service company with lead generation as a primary goal.
Marianne
Hi Marianne,
Thanks for the heads up – great idea! The only thing is that I need to find a way to make it useful without sharing actual (client) data.
Google Merchandise Store makes this really easy from an Ecommerce perspective.
Thanks,
Paul