Note: some of the links on this page are affiliate links. Link to affiliate disclosure.
You can derive great insights through the Google Analytics interface, but in my opinion it’s definitely limited.
Do you want to have a suboptimal conversion rate? I don’t think so. :-)
You surely want to get more customers, everybody does.
Standard GA reports are a good place to start your analysis and optimization efforts.
Three basic reports you should take a look at:
- Goals/transactions per traffic source
- Landing page effectiveness (bounce rate, conversion rate)
- Goals/transactions per device type
I love to start with this one:

You can get a good understanding of the performance of your website through these reports. In this case I show the organic traffic sources and their effectiveness.
Note: first you need to make sure your goals are correctly configured in Google Analytics.
However, you just hit the surface if you only concentrate on the basic reports that are available in Google Analytics.
I explained about the strength of custom reports a few weeks ago.
Often you need to dig even deeper to find the golden optimization opportunities you are looking for.
That’s when exporting data comes in handy or actually is a must.
Tip 9: Automate Your Google Analytics Data Export
You can export your Google Analytics data in different ways.
I will explain more about three methods.
- Manual Data Export in Google Analytics
- Automation via Google Sheets Add-On
- Automation via Supermetrics
Manual Data Export in Google Analytics
In almost every report there is a nice little Export button on top. It helps you to export the data in different formats. Most often people export to PDF or CSV/XLSX.
The PDF format works well if you need to send a quick data overview to someone.
CSV/XLSX is often used if you want to transform the data into a dashboard or Excel report.
After you get more experience in this field, you probably realize the export function in Google Analytics is often not enough.
It’s ok if you just need a single row of data. When you need a lot of different data queries, it takes too much of your valuable time.
Happily there are more efficient ways to export the data. Automation rocks!
Automation via Google Sheets Add-On
The Google Sheets Add-on is a great help in exporting data queries. The good news is that this one is completely FREE!
Make sure to check these two links:
How it Works
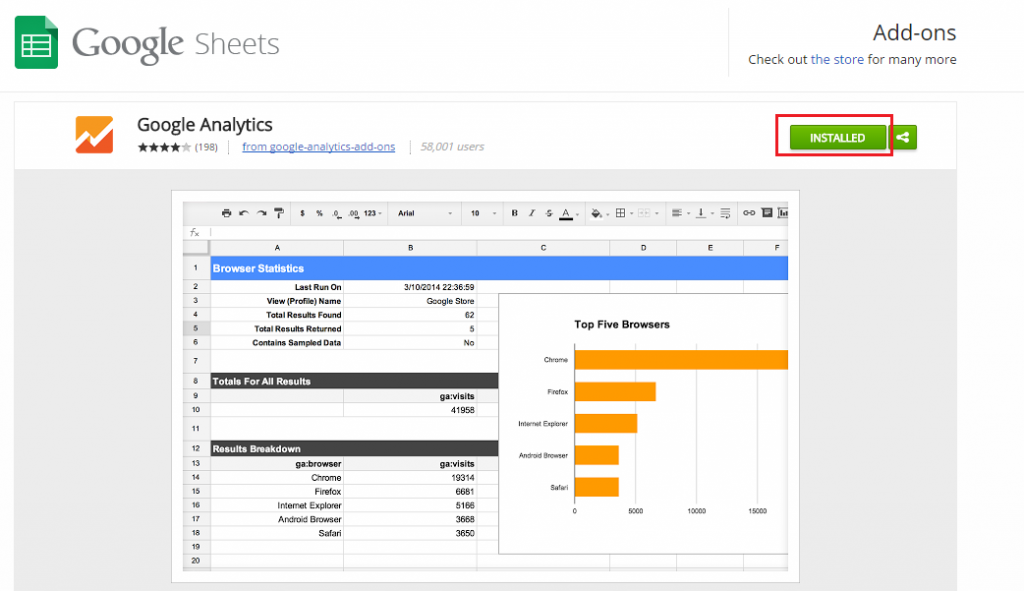
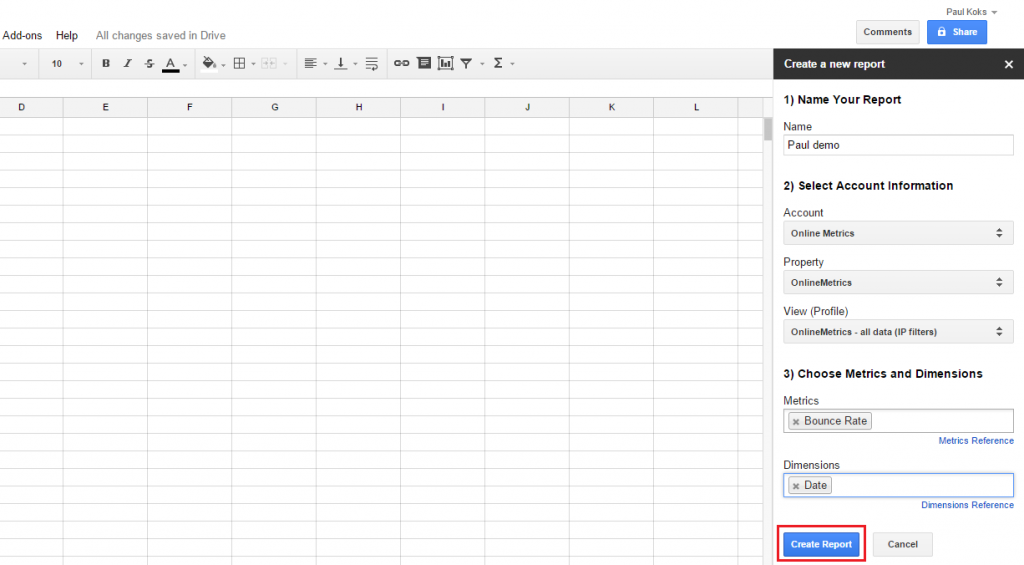
1. First you have to add the Google Analytics add-on to Google Sheets (in my case it is already installed).
2. After the new add-on is visible you can create your first report.
3. Fill in some basic information and the metrics/dimensions you wish to export and import here.
You need to add/select a couple of things on the screen above:
- Report name
- Google Analytics Account name
- Google Analytics Property name
- Google Analytics View name
- One or more metrics
- One or more dimensions
4. Add a report name and hit Run reports on the next screen.
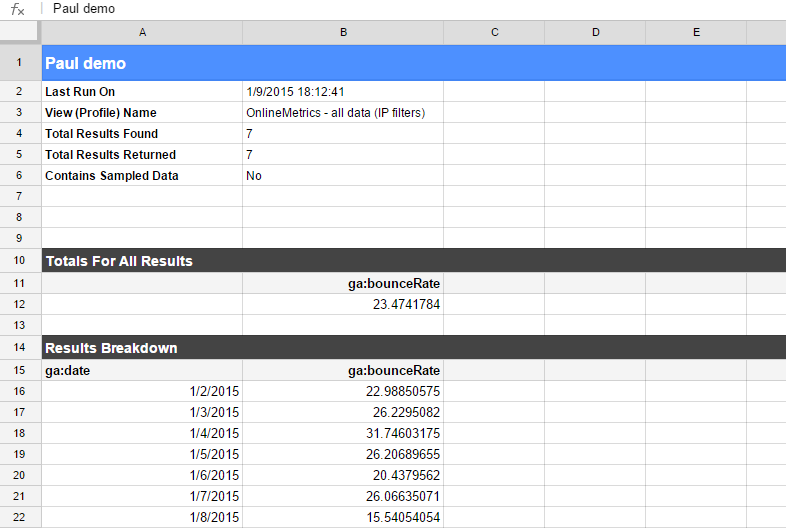
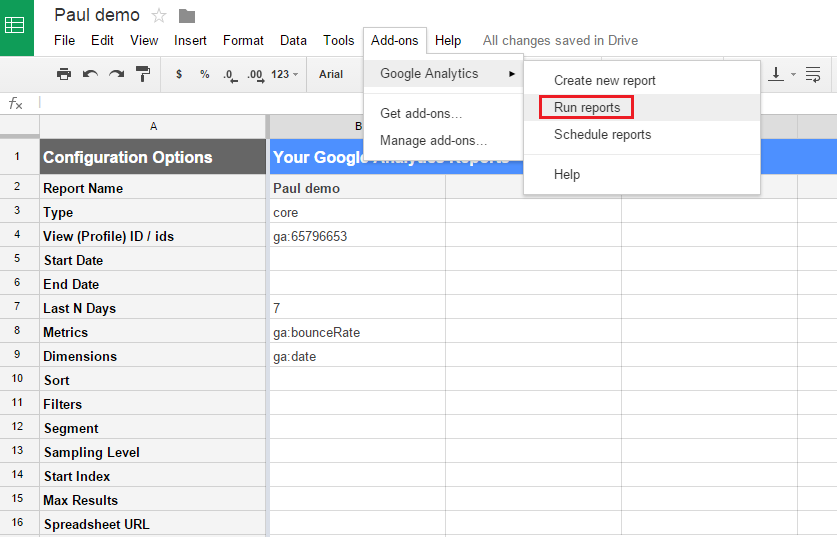 5. And your report is right here!
6. And as a final step you can schedule your report.
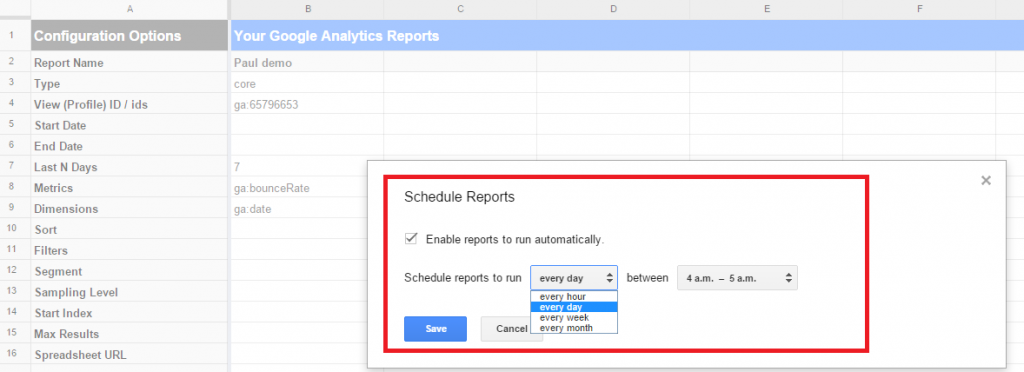 In this tutorial I have showed you how to build a basic report.
There are a lot of other options, but it a good practice to start with simple queries.
Learn more about it here: Google Analytics Reference Guide. This guide will show you what functions to put in every field.
Further you need to learn more about metrics and dimensions in Google Analytics. They are the building stones of all of your reports, analysis and optimization efforts.
Besides that you might want to experiment with building automated dashboards in Google Sheets.
Automation via Supermetrics
There are certainly more options to automate your Google Analytics data export.
I recommend to consider Supermetrics and find out whether it suits your needs.
This application is on my recommended Analytics tool list as well.
You currently have a few different options within Supermetrics:
Supermetrics Data Grabber (easy-to-use report automation tool for Google Analytics, AdWords, Facebook, Bing Ads, Twitter, YouTube & Google Webmaster Tools).
 Note: there is a 14 day trial with full functionality. After that period you can get the Google Analytics module for around $40 a month.
Supermetrics for Google Sheets (add-on that turns Google Sheets into a full-blown business reporting system for web analytics, social media and online marketing).
Note: there is a both a free and pro version available. When you first start using the add-on, you get a free trial period for the pro version.
Supermetrics Uploader (imports advertising cost data from any source into Google Analytics).
By using this tool you can better measure advertising ROI and save time. All the metrics and outcomes in one system! Prices depend on the number of uploads.
Supermetrics Functions (most flexible way of getting your business metrics into Excel and Google Spreadsheet; for advanced Excel users).
 If you have well developed skills in Excel, this is certainly an option to consider. And it is cheaper than Supermetrics Data Grabber. Currently their Google Analytics module is priced three times lower: less than $15 a month.
It goes into too much depth for now to explain the complete functionality of all these tools.
However, I hope you see the possibilities to automate your data export (and dashboards) and save time for analysis and optimization.
“Data functions as input, but it shouldn’t be your outcome.”
Just a couple of days ago, Supermetrics had a great message for all of us.
Please see the tweet below:
 Data sampling is a nightmare for many web analysts. Especially if you dive into large buckets of data. A topic for another time!
Happy analyzing and optimizing!
One last thing... Make sure to get my automated Google Analytics 4 Audit Tool. It contains 30 key health checks on the GA4 Setup.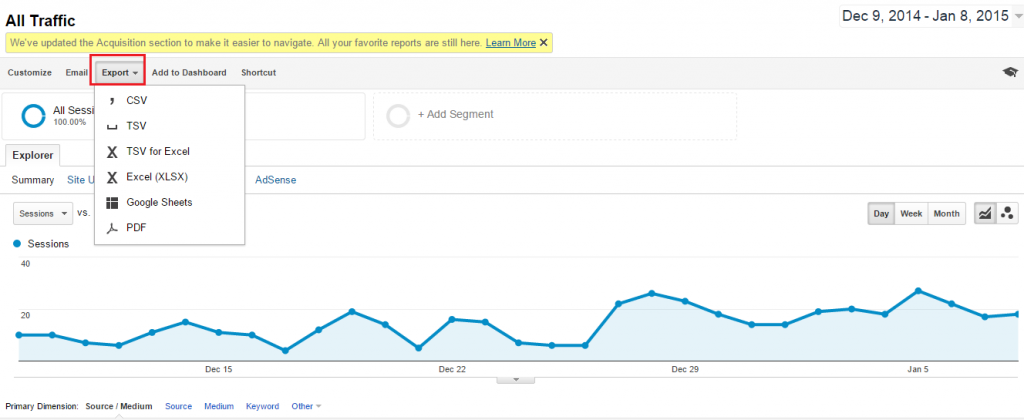

Thank you for an inspiring article.
However, I believe that these methods are only able to pull data from GA as aggregates.
May I suggest https://scitylana.com as another option. Scitylana is fully automated and will pull all raw data unsampled, user by user, click by click from GA (free edition) onto your local hard drive, and thus bypassing the need of GA premium. From here on you can use data in Excel, Power Pivot, Power BI, SQL Server or whatever you like.
Analyzing on non-aggregated raw data greatly expands the possibilities of web analytics and also enables integration with your own backend data.
Hi Jesper, thanks for your suggestion. Sounds like a solid solution!