Data analysis is hard. Make your life a bit easier by following a structured approach.
Two weeks ago an email triggered me to write this article. Market Motive reminded me of their courses which I took a few years ago (highly recommended!).
You might have heard it many times before, but the market for web analysts and data scientists is booming!
 In the last 10 years I have consulted on over 100 websites.
Projects ranging from one hour consults for start ups to large projects and websites that generate over 10 million pageviews each month.
Every project has its own, unique challenges.
The single most important thing that I have learned is that you need a plan to succeed.
You can easily waste hours of time if you don’t know what you are doing.
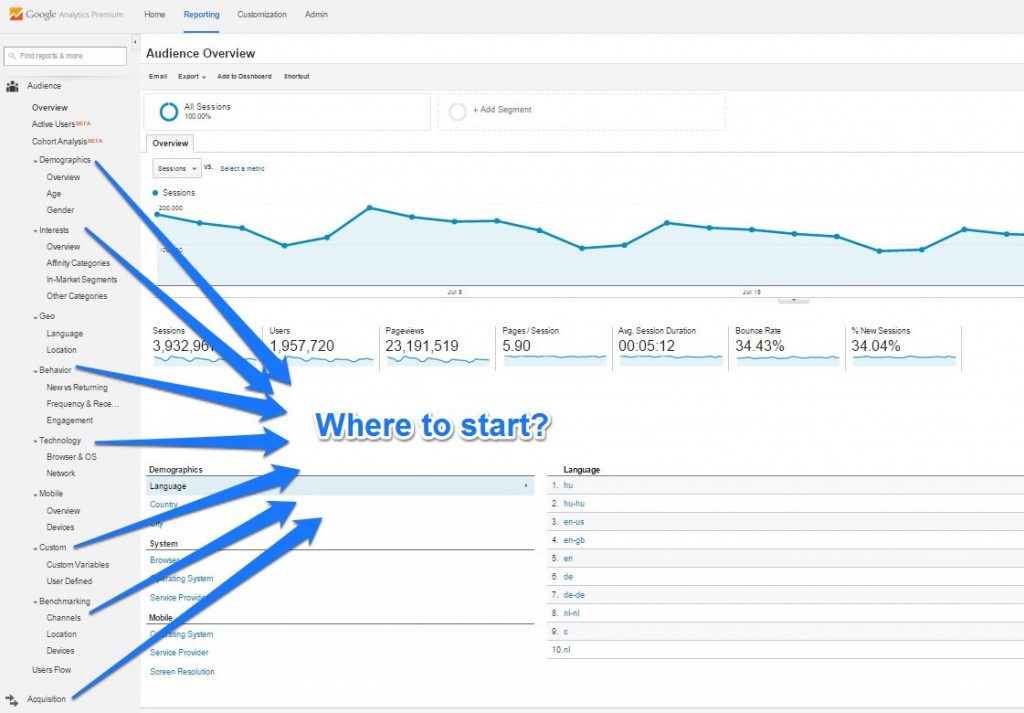
In the next 10 steps I try to outline a process that is easy to follow and at the same time incredibly powerful.
It helps you to get better results from your next data analysis and in a much quicker way.
The process will fit in any web analytics tool, although I assume most of you are familiar with Google Analytics.
1. Start With a Business Question
I strongly recommend to start every data analysis with a business question. Don’t end up in just puking data out.
What are you trying to solve or improve? The more concrete the better and just write it down on paper first.
Try to go in more detail than simple stating you want to increase the conversion rate.
You might want to evaluate the market (competitors) situation as well.
Answer this single most important question before you dive into any web analytics tool.
2. Know Your Stakeholders
Are you hired to perform an internal analytics data audit? Or did your boss ask for recommendations to optimize cross-channel customer journeys?
It makes much difference if you report to a Web Analyst or ecommerce Director? And whether it’s an internal or external assignment.
Figuring out who the stakeholders are is a crucial step in your data analysis project.
3. Exceed Expectations
Great, by now you know the main business question and you have compiled a list of involved stakeholders.
Maybe there are other expectations like:
- What other questions need to be solved?
- When is the outcome of your analysis expected?
- Do you need to report in a certain format? (Excel, Powerpoint, video presentation etc.)
- Do you need to minimize the report length?
- Is additional training on-the-job part of the assignment?
These and many other expectations might come up after interviewing your stakeholders.
Asking the right questions is an art.
Himanshu Sharma – one of the top bloggers in the web analytics industry – has written a thorough post on asking questions.
Take this seriously and try not only to meet, but exceed expectations.
4. Experience the Website
Don’t dive into web analytics data before you have visited the website or other environment connected to your project.
This is a very important step in your data analysis project.
What tasks can visitors fulfil? How would you define the macro and micro goals?
You might already get stuck on a few usability issues or find other areas of improvement.
Don’t get prejudiced here, but simply get an initial idea on how the website performs.
It’s great to incorporate Peter Morville’s User Experience Honeycomb in your journey.

- Useful: Your content should be original and fulfill a visitors’ need
- Usable: Site must be easy to use
- Desirable: Image, identity, brand, and other design elements are used in the correct way
- Valuable: Users must derive some value by visiting the website
- Findable: Content needs to be navigable and it should be easy to find
- Accessible: Content needs to be accessible to people with disabilities
- Credible: Users must trust and believe your stories
Always, but especially if you are working for an external company, you will benefit from this analysis during your project.
5. Configuration Check
Ask for Google Analytics account access and check whether the implementation and configuration are done in the correct way.
I am experienced in working with several web analytics packages.
In the last few years most of my clients had Google Analytics or Adobe Analytics installed on their website(s).
Both tools can be a pain to set up correctly. I can easily state that over 80% of the accounts that I saw were incorrectly set up.
When performing a configuration check you will find out what goals are measured and other things that might be important for your data analysis.
6. General Data Quality Check
Let’s assume the website’s data you have to analyze is captured in Google Analytics.
First of all you need a good understanding of the different reports, metrics and dimensions that are available.
I would suggest to take the following steps to assess the data quality:
- Take a look at diagnostics messages and spot anything that might be wrong
- Evaluate traffic sources; is there a logical campaign tracking structure?
- Evaluate goals (and ecommerce); do you see the right numbers showing up in Google Analytics?
- Evaluate content reports: do you spot many duplicate URLs due to query parameters?
- Are there any more spots that need improvement?
This step is so important. You cannot perform a good data analysis if the data quality is poor.
Larry Maguire wrote a terrific article on this topic.
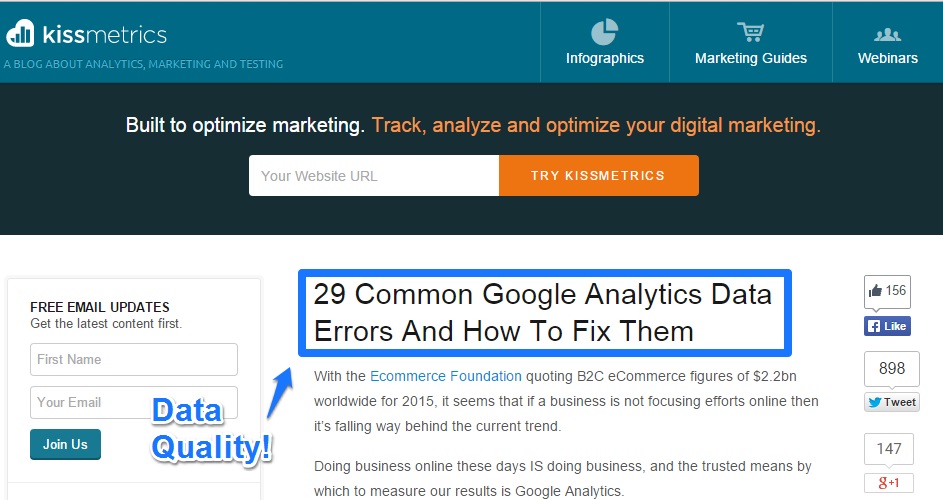 Make sure to read and share it!
7. Outline Document
You need to take a different approach, if you find too many barriers in the first six steps.
In general it would mean you have to get someone (or yourself) to help get the measurement part right.
For now, let’s assume everything is set up correctly.
I have learned from experience that outlining a document can really save a huge amount of time. It actually is a must do if you want to speed up your process.
Before you start your data analysis you should think about:
- What elements to include in your data analysis report
- How to structure the information
- From where to retrieve the information
You will know whether you needs to set up segments, custom reports or other stuff to enhance your data analysis.
Here is an example of an AB-test report outline that might come in handy as well.
8. Get Your Data
Your success lies in your preparation.
By now you have a thorough understanding of the website/business, stakeholders, business question, where the data is stored any more things that are relevant to a good data analysis.
So that you will know which reports and data you need to answer the most important business question for your project.
Read these 10 data analysis ideas to feed your ideas.
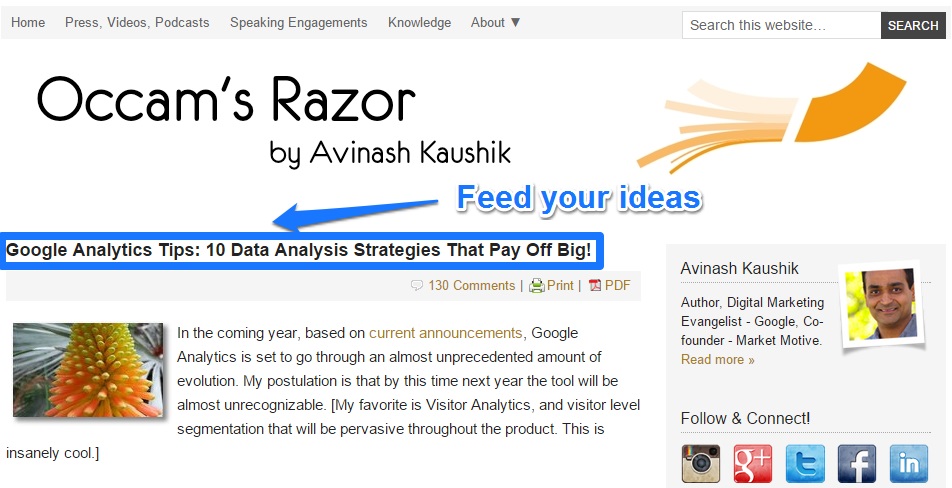
You might prefer to work with an API to easily extract the desired data. Automating your Google Analytics data export is a huge timesaver.
Make sure to keep working on your analytics skills if you want to deliver a great project.
If available, qualitative data will make your analysis even more powerful.
9. Analyze Your Data
Many people prefer to use Excel for data analysis and building charts.
I recommend not to copy simple charts from Google Analytics or other web analytics tools.
You want to visualize your data and make it the most easy to get your points and advice across.
My Online Training Hub offers a great set of Excel courses from which anyone can benefit.
I prefer to work with at least three different tab types in Excel.
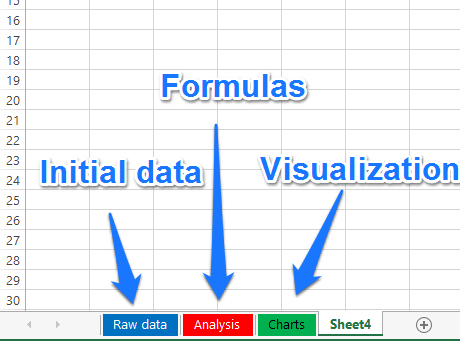 This makes it easier to work with your data and transform it with magical formulas into actionable insights.
Always keep your Excel files as you might want to update your analysis in the future.
Greg Reda shares a few more data analysis methodoly thoughts:
- Be skeptical about the data
- Think like a trial lawyer
- Clarify your assumptions
- Check your work
- Communicate
10. Prepare Your Report
Now it’s time to fill in your actual report (or online video) with the most important findings.
You always want to include:
- Introductory section
- Overview of report
- Date range of your analysis
- Most important findings
- Conclusions
- Recommendations / actionable advice
It depends on your stakeholder wishes how your final report should look like and what elements to include.
In the next video, Piyanka Jain shares how to derive decisions from data in a smart way:
Bonus: Share Your Data Analysis
You have done a great job, but don’t know how to communicate your results.
Here are some general tips on how to get your message across (and make your boss or client happy):
- Never just send an email without follow-up (your report might get no attention at all)
- If possible, set up a real life meeting and guide your audience thoughout your presentation
- Secondary option is to set up an online meeting and go through your presentation
Your job is almost done once you have communicated your findings in a proper way.
You need to make sure to check later on whether your recommendations are already implemented or not. Yes, it’s part of the job!
If you see the fruits of your labor it will be motivating and it enhances your chances of getting another assignment or a raise.
This is it from my side, hope you have learned something new!
Do you have additional tips on data analysis where others can benefit from? I am happy to hear your thoughts.
One last thing... Make sure to get my automated Google Analytics 4 Audit Tool. It contains 30 key health checks on the GA4 Setup.
I was looking for more info about analytics. Your site content is good as well as i got list of other leading analytics blog links. They are also very nice and contents are in depth. thank you.
Thanks for your comment Sarita and I am glad you like the post.