Analyzing aggregated data is very important and worthwhile, but sometimes you want to dive deeper at the individual level. The User Explorer report can help you exactly do that.
By performing both analysis on the aggregate as well as the individual user level, you will enrich your understanding of what’s going on. And what you should do to further optimize the user experience and your business.
However, you can easily waste hours of your time if you simply click around in the User Explorer report in Google Analytics.

This can be fun, but at the end it doesn’t bring in extra money for you or your client.
You need to define a business question first!
What are you trying to solve or improve? Are there any segments you need to examine in greater depth?
Read my in-depth guide on setting up goals if this sounds unfamiliar to you.
In this blog post I will explain all about the User Explorer report and how you can turn this data into actionable insights.
Table of Contents
- Explanation of Client ID
- Client ID in User Explorer Report
- User ID Instead of Client ID
- How to Explore Individual Users
- Three Use Cases
- Concluding Thoughts
Explanation of Client ID
It is important that you have a solid understanding of the client ID before you start working with the User Explorer report.
In order for Google Analytics to determine that several hits belong to the same user, a unique identifier must be sent with each hit.
This unique identifier is called the client ID. By default, this value is stored as part of the first-party analytics tracking cookie with a two-year expiration. The value anonymously identifies a browser instance.
The GA Debugger is one on the tools that can identify the client ID for you.
A few simple steps help you to retrieve the client ID of your session in no time.
Step 1: install GA Debugger
Step 2: turn the extension on
Step 3: visit a website where Google Analytics (Universal) is implemented
Step 4: hit Ctrl+shift+i (in Chrome)
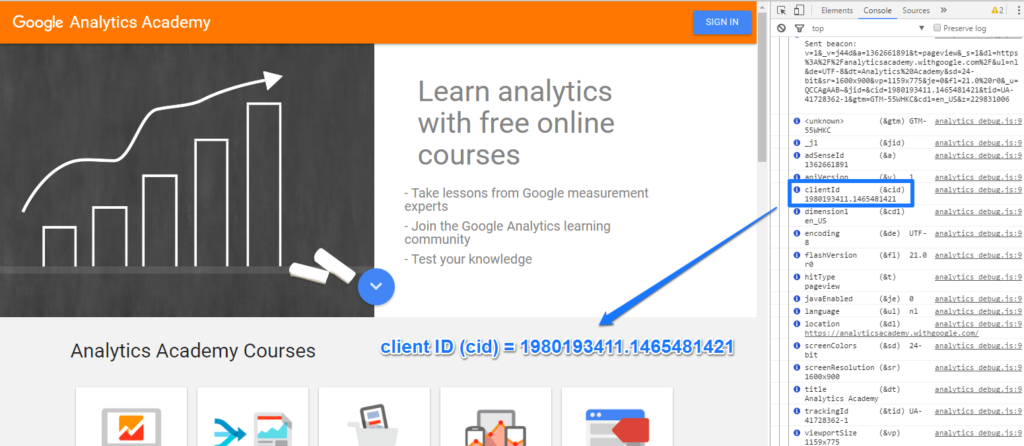
In this case the client ID = 1980193411.1465481421.
The client ID consists of two numbers:
- 1980193411 (unique random number)
- 1465481421 (first time stamp)
For every subsequent hit of the same user, the same client ID will be set.
Keep in mind that this only works in the following situation:
- The user didn’t delete or block the cookies in the meantime.
- The user didn’t change their browser.
- The user didn’t change the device type (e.g. mobile, tablet or desktop).
You might want to consider implementing a user ID if you are responsible for a website where many visitors log in. This will help you recognize visitors even when they switch to another browser or device.
Client ID in User Explorer Report
The client ID is the key identifier for compiling the User Explorer report in Google Analytics.
Navigate to Audience >> User Explorer
This is a report example:
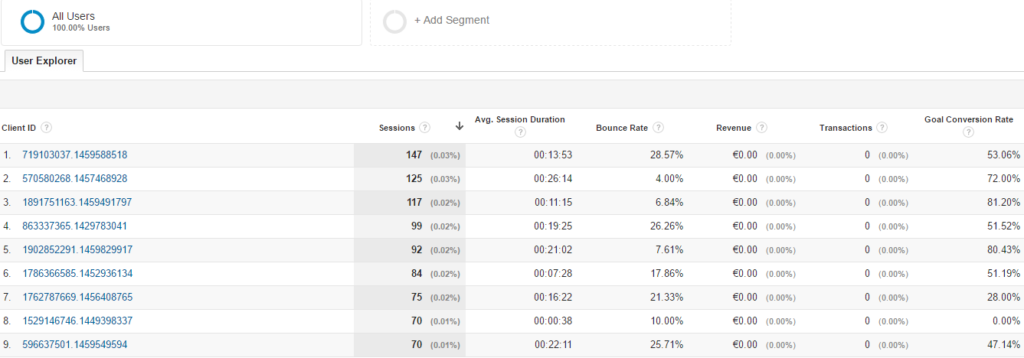
On default this report shows:
- One dimension (Client ID)
- Six metrics per client ID (Sessions, Avg. Session Duration, Bounce Rate, Revenue, Transactions and Goal Conversion Rate)
The first Client ID shows:
- 147 sessions in the selected period (a huge fan of this website :-))
- Roughly 13 minutes as average session duration
- Bounce rate of close to 30%
- No transactions / revenue
- Goal conversion rate of 53%
The goal conversion rate is the sum of all individual conversion rates of goals that are set up in the Google Analytics view.
Keep in mind that this number doesn’t make a lot of sense if you set up engagement goals like x pages seen or y time spend on site in addition to your most important goals. These goals usually inflate the overall goal conversion rate number.
I recommend to not set up engagement goals in the reporting view where you work with the User Explorer report.
In a later chapter I explain in more depth about analyzing client IDs.
User ID Instead of Client ID
The User Explorer report in your ‘user ID’ view will include user IDs instead of the client IDs if you have implemented User ID tracking.
The report structure doesn’t change much, it’s just that you are looking at another set of users. Users that you have identified via a user ID.
Keep in mind that the User ID report will be much more accurate in terms of reflecting your “real” users. You can follow users across multiple devices and browsers.
Watch this video if you want to learn more about the User Explorer report and user IDs:
How to Explore Individual Users
You need to click on a client ID to learn more about a particular user and his behaviour in a selected time period.
Here is an example:
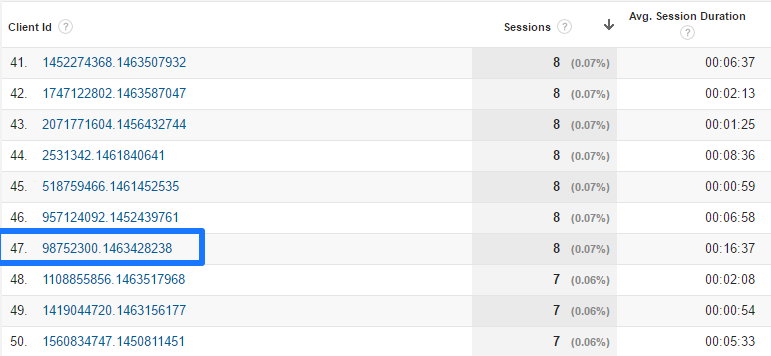
After I click on the link the following report shows up:
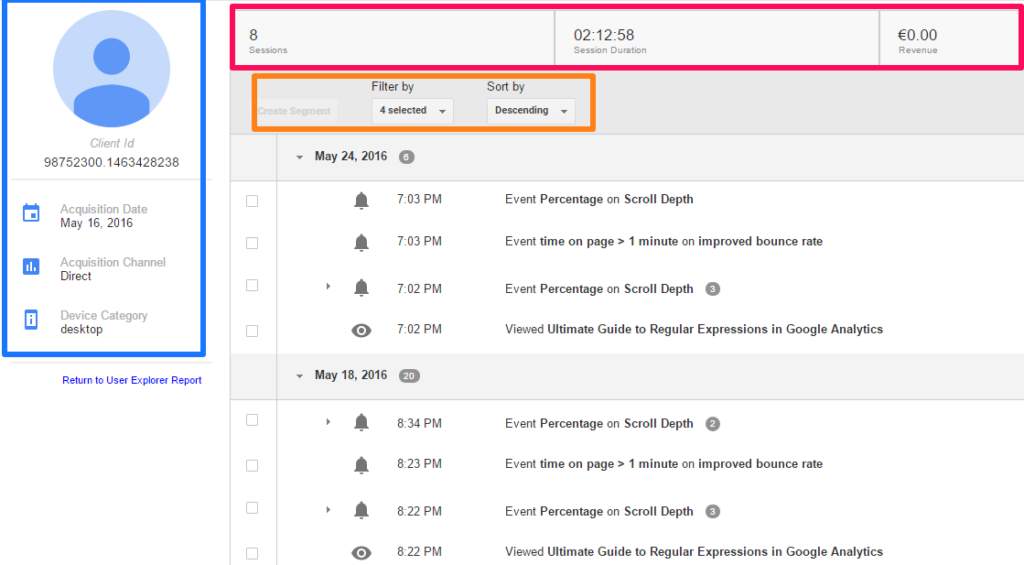 In the top left corner you can review this information:
- Client ID of user
- Acquisition date (first visit: May 16, 2016)
- Acquisition channel (direct traffic)
- Acquisition device (desktop)
On top you find some additional information:
- Total number of sessions including aggregated session duration
- Total revenue (only relevant if ecommerce is enabled)
In addition to this you have the option to filter and segment your data:
- You can sort all instances (descending and ascending)
- You can filter on pageviews, goals, ecommerce and events
- You can directly create a segment based on an action taken by the user
Additional Remarks
- The “original” acquisiton date is shown in the client ID overview report. Thereby it doesn’t matter whether the acquisition date falls within or outside your selected period. The first date will always be shown.
- Filter on one or two dimensions at a time and don’t try to analyze all events, goals and pageviews in one time.
- Deselect events if a lot of them are fired on your website. They only bring noise to the data.
- It’s a great feature that you can directly set up segments from here. However, for events it is less useful since you can only work with event category and event action.
- Be careful with saving segments. Before you know you have saved it to all views and accounts that your email address is linked to.
I recommend to set up a separate view that only includes your sessions (IP address) so that you can collect some data for the user report that only belongs to you. By doing this you will learn how the report is built and what information you can derive from it. Make sure to read my in-depth filters guide if you want to learn more about how to set this up.
Three Use Cases
Ok, we can see more information on the individual user level, but how do we make it really actionable? And this without losing ourselves in clicking from one client ID to the next?
I like to share three use cases of how you can make this data extremely useful.
Analyze a Specific Segment of Users
Segmentation is one of the most powerful features in Google Analytics.
I have already wrote a bunch of articles on this topic. Check them out if you want to further educate yourself on segmentation:
- 10 Differences Between View Filters and Segments
- How to Leverage Sequence-Based Segments in Google Analytics
- 20 Ecommerce Segments to Improve Your Customer Insights
- In-Depth Overview of Different Google Analytics Segments
Segmentation is really important to better understand your users and their needs.
For example, you might find out that visitors on mobile that enter your website on a high trafficked landing page don’t convert very well. It wouldn’t matter that much if this specific segment is very small. However, if it has a lot of potential you might want to dive deeper.
You could set up a segment that captures those visitors and start analyzing a few of the individual sessions in more depth.
- Do visitors directly bounce after arriving or do they simply need to scroll down too far to see the call-to-action?
- Do visitors return more often or does a visitor have one or two sessions on average?
If you set up hoover and scroll tracking you can learn a ton via events triggered in individual sessions. In addition you could work with session replay recordings. It’s a great way to uncover a problem that keeps a certain group of visitors from converting.
Two last things:
- Make sure that you define your segments upfront (and don’t waste your time clicking on client IDs).
- The usage of user-level segments is preferred above session-level segments.
Analyze Your Buyers
It can be worthwhile to analyze the journey of people who make purchase or complete a macro conversion on your website.
An example:
- 10.000 visitors per month
- 2% conversion rate (user-level)
- 200 conversions in a month
- Study 25% of the users who convert = 50 “studies”
You will get a clear indication of the conversion path of your buyers and this can help you structure your content and other marketing efforts in a better way. Don’t expect to find one solution that you can directly implement, it’s not that simple. However, you will definitely uncover potentially effective user journeys to use for your conversion optimization plan.
Focus on what users tell you instead of trying to tell your users what they have to do. There are a lot of signals in your data that can help you further optimize the user experience and your conversion. Don’t make the mistake to simply deploy a change. Make sure to test first (if your numbers are high enough).
Read this article about Google Analytics and A/B testing to learn more.
Enhance Your Remarketing Efforts
This is especially useful if you run an ecommerce site. It doesn’t matter whether you sell a few different services or thousands of different products.
Most probably you have an “add-to-cart” button on your website.
The add-to-cart button relates to a very important metric. Usually when this add-to-cart rate goes up, your conversions will be higher as well.
However, the number of people that abandon their shopping cart has dramatically increased in the last 10 years. Keep in mind that the number of vendors in each market has grown at the same time.
A Baymard study at the beginning of 2016 shows an average cart abandonment rate of close to 70%. It’s based on 30 different studies.
Remarketing those visitors with a purchase intention who ended up not purchasing your product or service is a golden opportunity!
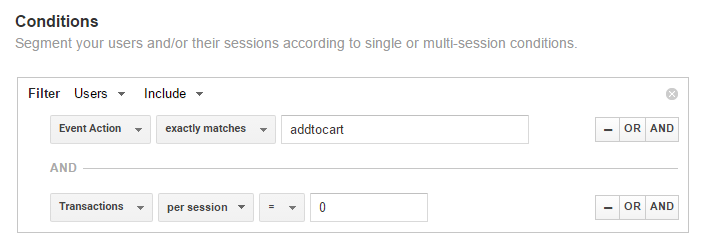
Scenario:
- Event tracking is implemented.
- Event action: addtocart
- Ecommerce is implemented
One segment to reveal the intentional buyers who didn’t buy:
 For this particular site here are all the numbers:
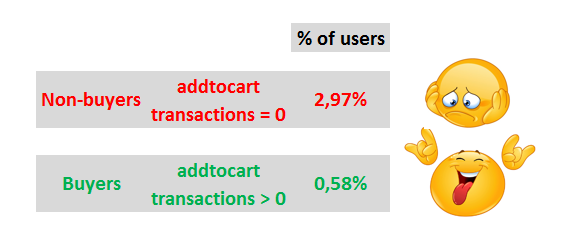 Here we go: 0,58% / 2,97% = 20%. Without doubt this site has to deal with a huge add-to-cart abandonment rate.
Here is how to deal with this situation:
- Set up a segment and connect the data to a remarketing campaign to target all people who have added a product to their basket but didn’t end up buying.
- Do a brief investigation on the individual level (via User Explorer report) to find out more background information of this segment. Based on the results you can set up:
- A separate remarketing campaign for different segments (based on product category or specific product).
- A segment and remarketing campaign that spans over all your products.
And there are many more ways to deal with this situation. The important thing to keep in mind is that the User Explorer report can be a great addition to the aggregated reports in Google Analytics.
You have to tap into your own creativity and combine it with your specific business goals to get the most out of this user-level report.
Concluding Thoughts
- The User Explorer report is a great addition to the other reports and features in Google Analyics.
- This report is definitely not the first report to look into. Make sure to think about segmentation and which specific user groups you want to examine and target first.
- I like to start with an aggregated data analysis before moving on to more detailed analysis (on the user level).
- This report is not meant for people who are just starting out in the digital analytics field. You need to have some experience to really understand how to use the report for greater insights.
- The functions within the report are still rather limited. You cannot build your own set of custom reports based on the client ID.
- Exporting the data can help you merge online and offline data. Or investigate specific client IDs to personalize user experiences.
- There are dozens of ways to make this report useful. Think about your website goals and how this report can help you get better results in addition to a more aggregated optimization approach.
This is it from my side. What is your experience with the User Explorer report so far? Do you have any tips? Happy to hear your thoughts!
One last thing... Make sure to get my automated Google Analytics 4 Audit Tool. It contains 30 key health checks on the GA4 Setup.
Definitely excited to see the User Report launch, although I wish it were a bit more directly actionable. I’m hoping that the “The User ID value can not be queried as a dimension in reports in either the web interface or the APIs” limitation will be removed in the future!
Hi Kelly,
Check out his article by Simo:
http://www.simoahava.com/analytics/improve-data-collection-with-four-custom-dimensions/
You can set your User ID as a custom dimension and take it from there.
Best,
Paul
Another great read Paul! For additional reading material related to the User Explorer report using the User ID and segments, please check out an old post: http://www.practicalecommerce.com/articles/127152-Google-Analytics-Track-Individual-Behavior-in-New-User-Explorer-Report
Thank you Brad and I will check it out!
Thank you so much for the awesome explanation. Really you put a lot of time in this! Can we query user explorer data through apiv4 and get a summary of all events ortransactions by each user?
I think you can’t get the data directly via API v4. But what you can do is setting up a custom dimension that captures the Client ID. You can than use the API to export data.