Custom reports are among the most useful features in Google Analytics. They enable you to summarize and present your data in a way that best suits your business goals.
Are you scanning through many different standard reports every week?
Then it’s definitely the right time to take a thorough look at your online objectives and translate them in a few KPIs. And concentrate on what really matters for your business.
 A great option is to create a few custom reports in line with your KPIs.
In this article I will share three different methods that help you build your next custom report.
How to Create Custom Reports
Instead of immediately hitting the New Custom Report button in Google Analytics, I recommend to outline a few things first.
You should at least answer these questions:
- What is your main online business objective? Or do you have two or three?
- What are the KPIs that suit each of your business objectives?
- How can you measure these KPIs in Google Analytics? Include macro and micro goals.
- What combination of metrics and dimensions is a great place to start?
I recommend to read Avinash’s post “Web Analytics 101: Definitions: Goals, Metrics, KPIs, Dimensions, Targets” if you need some more inspiration here.
In the following section I dive deeper into three methods you can use to create custom reports in Google Analytics.
1. Create Custom Reports from Scratch
I assume that by now you have a good overview of interesting metrics and dimensions for your business.
It’s time to translate them into custom reports.
Creating custom reports from scratch is what most people do.
Google Analytics currently contains four main tabs:
- Home: overview of your Google Analytics account.
- Reporting: reporting interface where you can see your data and reports.
- Customization: section devoted to custom reports.
- Admin: admin interface where you can configure your Google Analytics account.
Step 1: Click on Customization tab in Google Analytics.

Step 2: Click on New Custom Report link.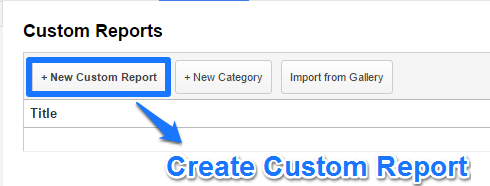
Step 3: Fill in all details of your custom report.
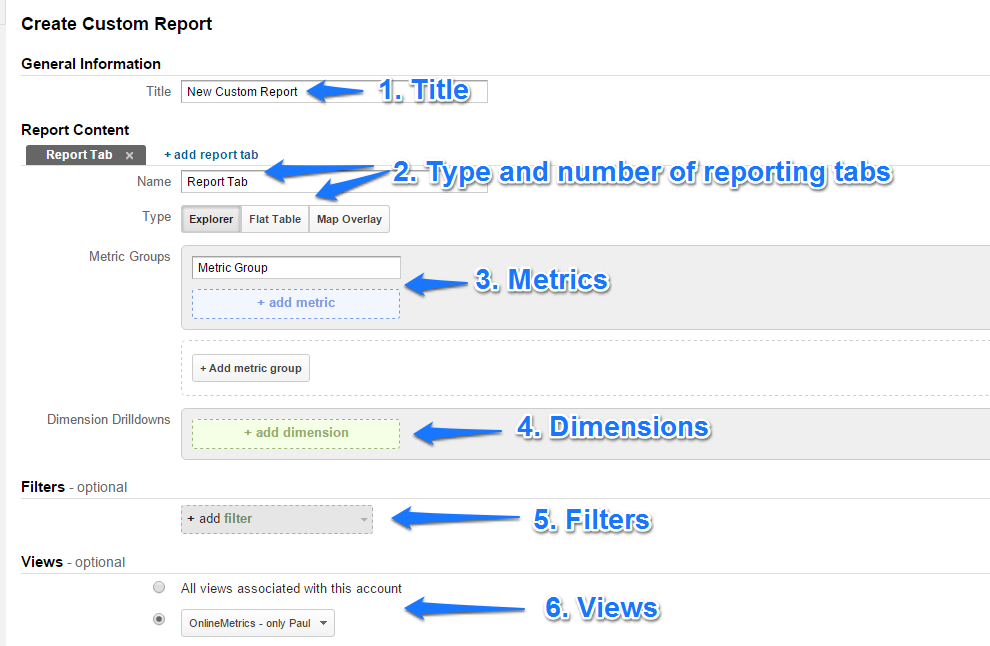 1. Report Title
Choose a suitable name that you and others that have access to the custom report can easily remember.
2. Type and Number of Reporting Tabs
Select a new report type for every tab you add to the custom report. Each tab can have a different report type.
For example, your report consists of three reporting tabs: explorer, flat table and map overlay.
Keep in mind that combining multiple tab types might be confusing at a certain point. Especially for those who are less familiar with the background of your report.
Different Report Tab types:
- Explorer: Default Google Analytics report. Includes dynamic elements like a search and sort option and secondary dimensions. Easy to drill down.
- Flat Table: A static, sortable table that displays data in rows.
- Map Overlay: Different regions and countries are displayed in different colors to indicate relative traffic and engagement volumes per region/country.
3. Metrics
This is where you can add a couple of metrics that are in line with your business goals.
You can choose between default and custom metrics (if they are set up in your account).
4. Dimensions
This is where you can add a couple of dimensions that you want to use for segmentation or drilldown purposes.
You can choose between default dimensions and custom dimensions (if they are set up in your account).
In terms of metrics and dimensions these are the limitations of each type:
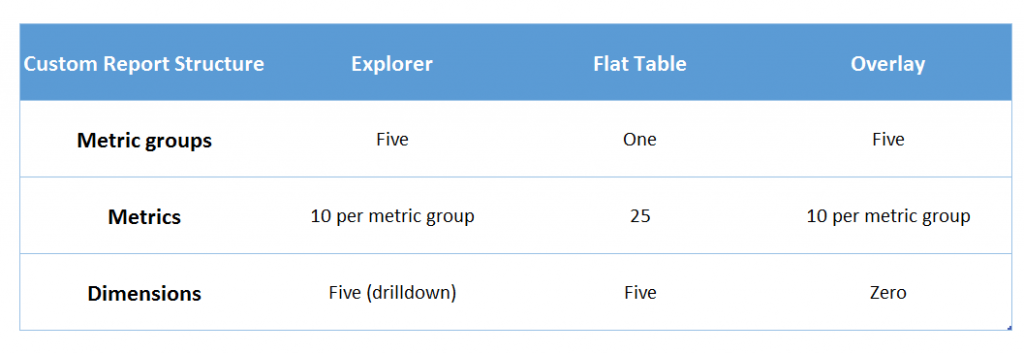
It’s good to know the limitations, although I recommend to refrain from trying to build the biggest custom report possible.
A flat table with 25 metrics doesn’t make a lot of sense in most cases. :-)
The key here is to trim down your metrics to a few great ones that matter.
5. Filters
Filters are one of the two optional settings of a custom report. They allow you to restrict the report to a subset of the total data.
I could add a filter to only select pageviews and sessions for tablet users.
You have many options here and you can save and preview the report at any time. It’s very easy to edit a custom report after saving it.
I recommend to check out this article if you would like to learn a lot about filters in general.
6. Views
Here you can specify to what views you like to add the custom report you have just created.
Sometimes it is useful to add a custom report to different views.
Step 4: Save your custom report.
Once you are happy with your settings, you can save your custom report.
You can even create different categories for your custom report which can be a handy feature as well.
Tip: overview of useful resources related to creating custom reports.
2. Transform Standard Reports into Custom Reports
Last year I wrote an article about how to use standard reports to create custom reports.
This is the second option I shortly like to touch upon.
Why you should use this option?
Especially if you are new to custom reports this can really help you:
- Figure out how to structure custom reports.
- Figure out how drilldowns work.
- Get some inspiration.
Short Tutorial
Step 1: Head over to standard report and click on customize.
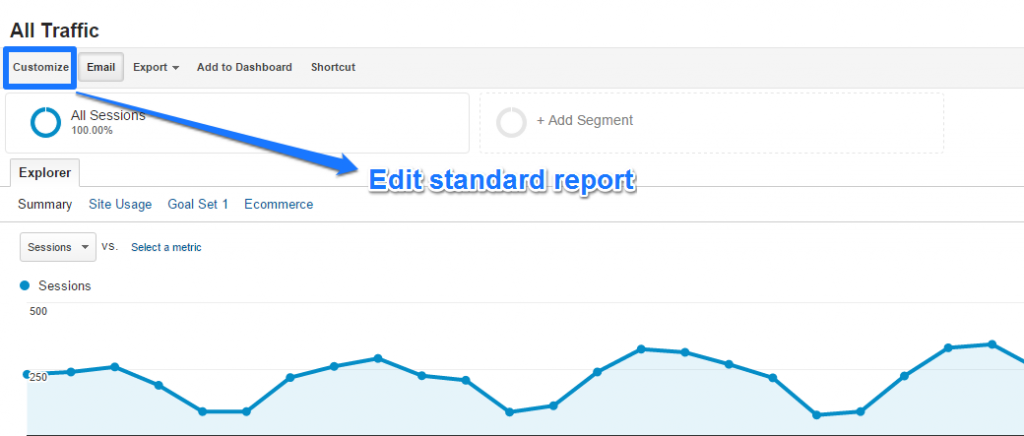
Step 2: Make all your desired changes and save your report as a custom report.
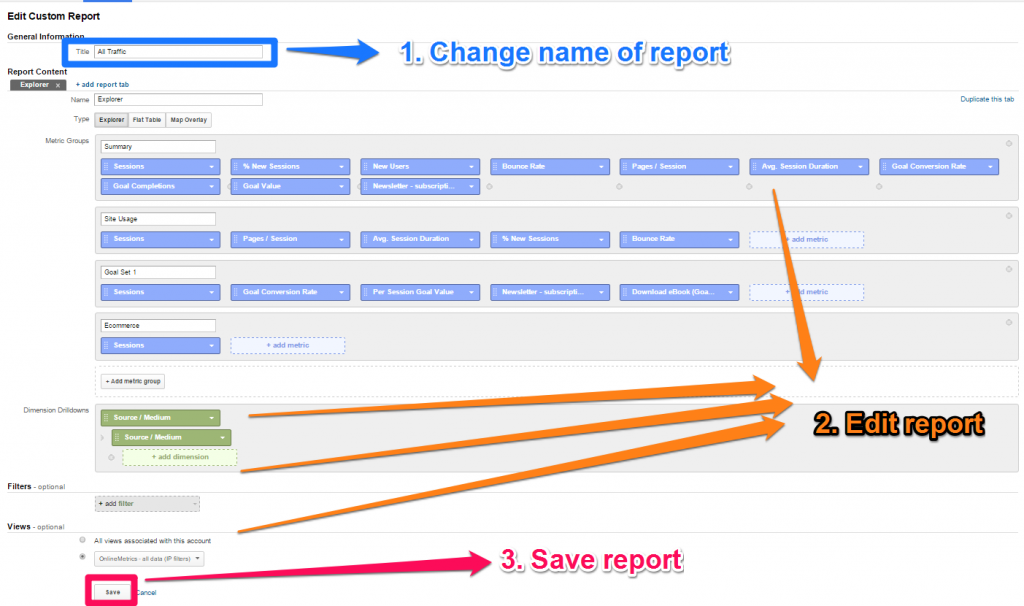 It’s as easy as that!
3. Import Custom Reports from Solutions Gallery
A third, but very useful option, is to directly browse around in the Solution Gallery.
You can also find a lot of gems there that give you an idea about what’s possible with custom reports.
Instead of this, you could also click on a link directly from the customization interface:
 After you click on the link a popup appears:
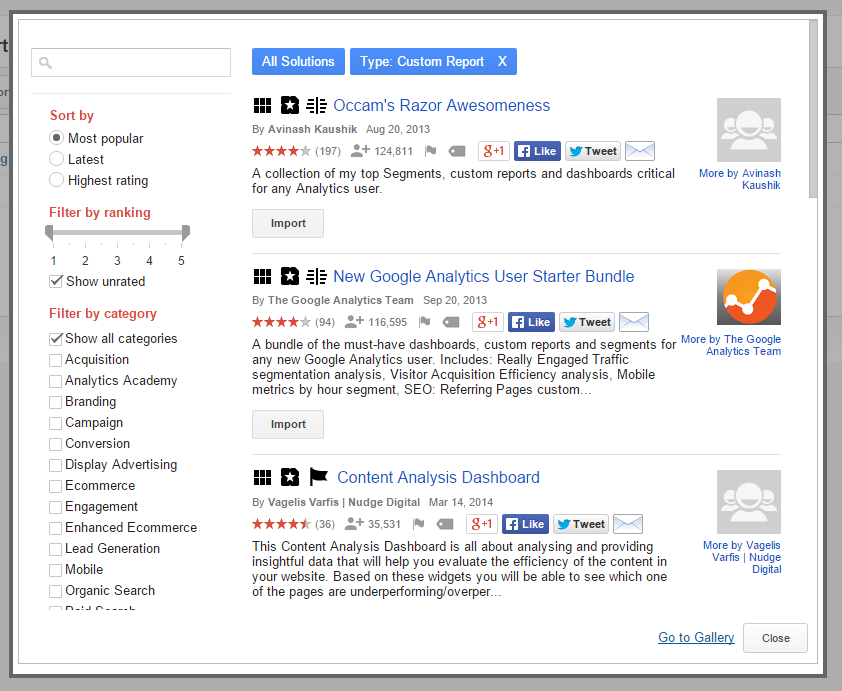 Next step is to click on one of the import links to transfer all custom reports (or other stuff) to your account.
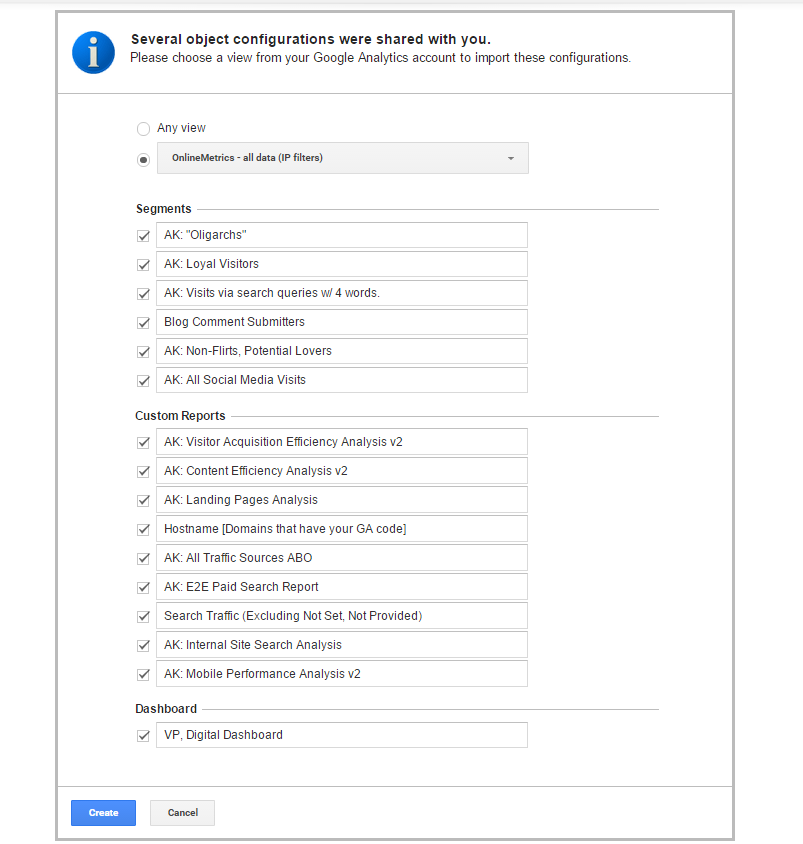 You can choose which items you like to import and to which view (one or more).
Your online business objectives and KPIs are unique.
Sometimes you just need some extra inspiration to get started. That’s when creating custom reports via options two and three come in handy! I hope you are inspired to set up your own set of custom reports.
What is your experience with creating custom reports? Do you have one or two methods that you prefer? As always I am happy to hear your thoughts!
One last thing... Make sure to get my automated Google Analytics 4 Audit Tool. It contains 30 key health checks on the GA4 Setup.
Leave a Reply