Visualizing data is one of the most powerful ways to uncover meaningful insights to your boss, client or anybody else who is interested in your website’s performance. Plain website data is boring and is often not very easy to interpret.
Besides that, it is very handy to get a broad overview of your performance first before looking at the details.
In this post I will explain a very effective visualization technique to uncover insights from search. I will focus on Organic Search Data, but the same method can be applied to Paid Search or even Internal Site Search Data.
For this analysis the data of my “Marathon Training” website is used. Let’s start in Google Analytics.
1. Show All Organic Search Data
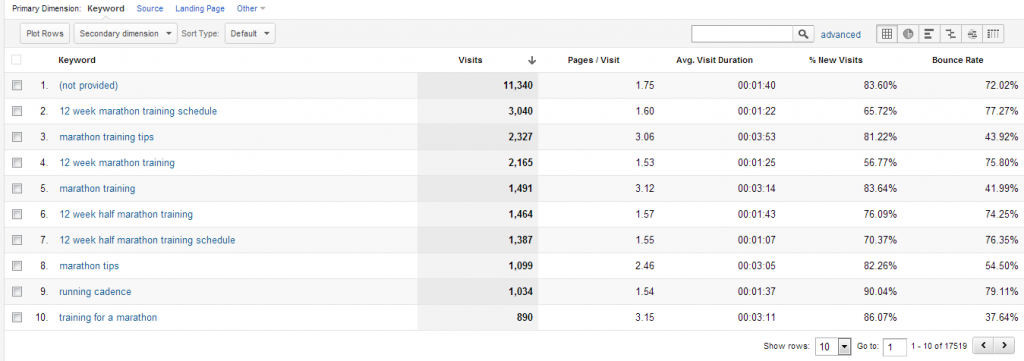
First of all I navigate to the Organic Keywords in Google Analytics and filter on the keyword overview. The report looks as follow:
As you can see, right under it shows that in the selected time period people arrived on my website through 17.519 different search terms.
Wow, it would take quite some time to look at those keywords individually.
On default Google Analytics can show you 500 keywords at once, but with a little trick I can see 20.000 keywords instead!
To make that happen simply search in your Google Analytics report URL for something that looks like: %3D0%26explorer-table.rowCount%3D25%26 (I did filter on 25 rows here).
Replace the number 25 with 20.000 and magic happens! :-)
Now we need to export the Organic Search Data as a CSV file and open it in Excel.
2. Modifications In Excel
By now I assume you have imported your data file in Excel. In order to make the file ready for further usage please perform the following steps:
- Delete the first 6 rows in Excel (until all the data and one line above remains)
- Navigate on the top nav bar in Excel to Data >> Text to Columns
- Choose “separated” in step 1
- Use “separate by comma” in step 2
- Set your first column to “text” in step 3
And bingo, you are there.
Then select all the keywords from cell A2 to the last keyword in cell A17520 (in my case). Copy the keywords and you are ready for the last step.
3. Create A Beautiful Organic Search Data Cloud
I hope you are getting excited by now!
Let’s go to Wordle.net. Paste all of your Organic Keywords here and it should look like this:
Hit the “Go” button and there we are:
It shows me in one overview the most important organic keywords for my website. It is very obvious that in this case “marathon” and “training” are very dominant in my organic search strategy.
To go one level deeper, I can “delete” those two words in the cloud and see what happens:
Bonus!
Insights And Learnings
In my opinion this Word Cloud looks beautiful but at the same time is very actionable. How should you use this Word Cloud? A few tips:
- Judge how well you are doing on branded terms (head terms) versus long tail. What phrases deserve more attention?
- Compare your Organic Search Data with your Paid Search Data and find hidden opportunities on both sides
- Make a Word Cloud of your Internal Search Engine and get ideas on how to optimize your navigation structure based on visitors intent. And use the outcome for optimizing your Organic and Paid Search Campaigns
Well, I can go on for hours, but I am sure this will help you in the right direction.
Read this in-depth post on how to effectively use Google Data Studio to learn more about data visualization in general.
One last thing... Make sure to get my automated Google Analytics 4 Audit Tool. It contains 30 key health checks on the GA4 Setup.


Leave a Reply