Google Analytics has many powerful features. And most of us have a hard time keeping up with all the possibilities that are out there.
In this post I explain the most important aspects of secondary dimensions in Google Analytics. After reading this article you will want to use them a lot!
If you haven’t used them yet, secondary dimensions help you to put your data in context. This is really needed to gain greater insights and improve your website’s performance.
Difference Between Metrics and Dimensions
On default, Google Analytics shows you a report with one dimension and a couple of metrics.
Dimensions are on default visible as rows in Google Analytics and they can be seen as a set of characteristics of a group of visitors on your site. Three examples: landing page, device type and language.
Metrics are the numbers that usually populate those rows. Time on site, bounce rate and ecommerce conversion rate are some examples.
If you know the difference between both, it is much easier to get the bigger picture of analyzing data.
I recommend to check out these 10 actionable tips to master metrics and dimensions as well.
Why to Use Secondary Dimensions
If you look at only one dimension and many different metrics, there is no way to put your data in deeper context than the first basic segmentation level.
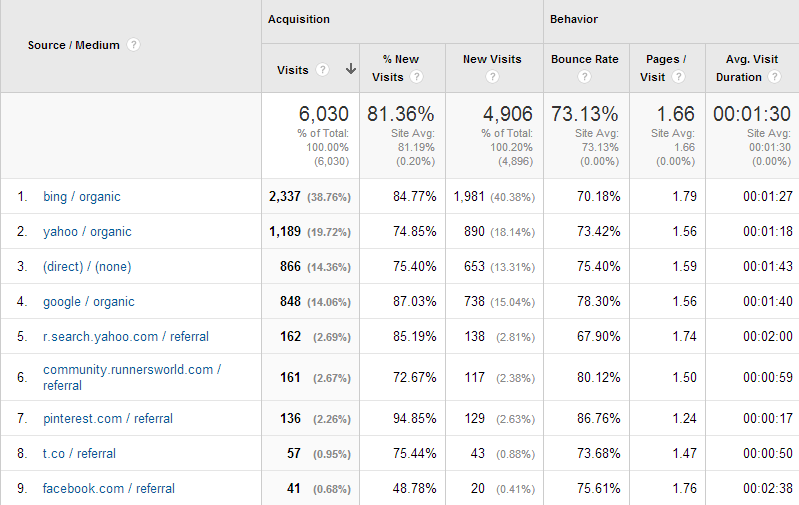
Let’s take a look at an example below:
The data above shows me the average bounce rate per traffic source and medium combination.
You can immediately see that the bounce rates are roughly varying between 70 and 80%. But what’s happening on a deeper level? Are specific segments performing better than others?
Three Ways of Using Secondary Dimensions
If you want to put your data in more context, I recommend using secondary dimensions in one of these ways:
- Keep the primary dimension fully active and place a secondary dimension next to it
- Drill down on one primary dimension and select a secondary dimension
- Use two primary and one secondary dimension(s) (!)
Option 1
Use this option if you want to look at all traffic channels in relation to landing pages (as an example):
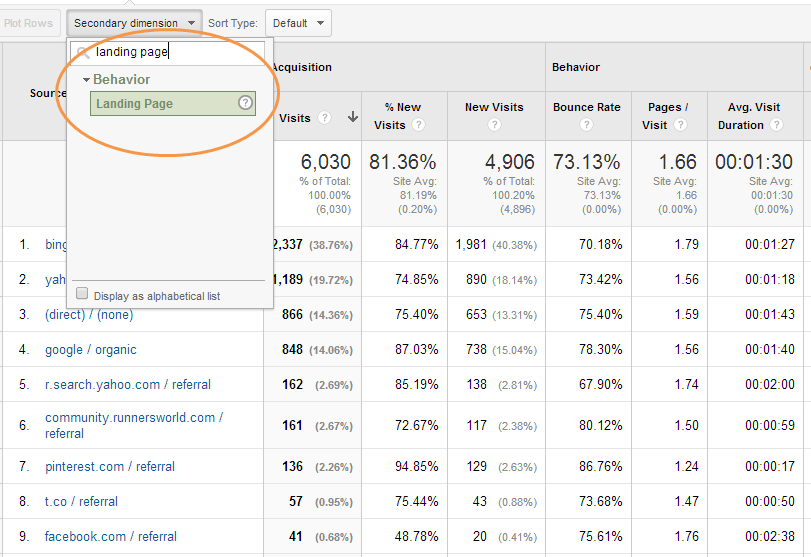
First step, type in the dimension in the “secondary dimension” field:
Second step, hit the “landing page” link:
Extra insights at a glance!
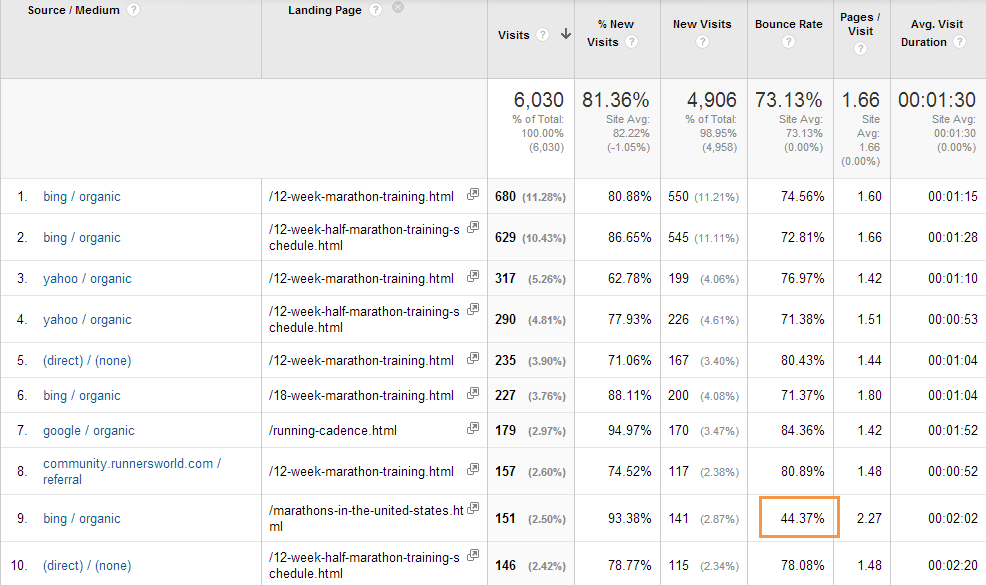
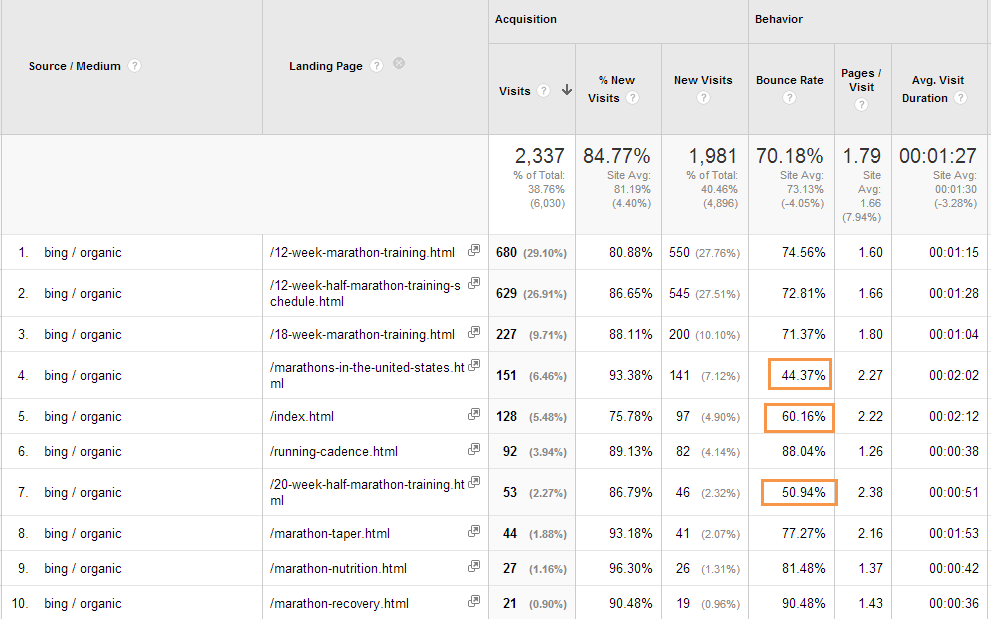
Please take a look at the “bing / organic” segment. The “Marathon in the United States” page is performing far above average.
In this case, this page is a hub page, distributing traffic to underlying pages. This compared to the niche/detail pages about marathon training schedules.
There are many more dimensions to look into to get a better idea of how your traffic channels are performing.
Don’t forget to set up goals and segments to see how well your landing pages are performing. Bounce rates don’t tell the complete story!
Option 2
Use this option if you want to look at one traffic channel in relation to landing pages:
You can easily access the data above by clicking at the “bing / organic” link first and selecting the secondary dimension after (in the same way as option 1).
In the top 10 landing pages (bing / organic) there are three “top” performers with relatively low bounce rates.
Read this comprehensive post if you need more information on secondary dimensions and pivot tables.
Option 3
Use this option if you want to become a dimension segmentation hero! :-)
- Select all traffic report
- Click on the traffic channel you like to dive into (bing / organic)
- Change your primary dimension to landing page
- Select as your secondary dimension device type
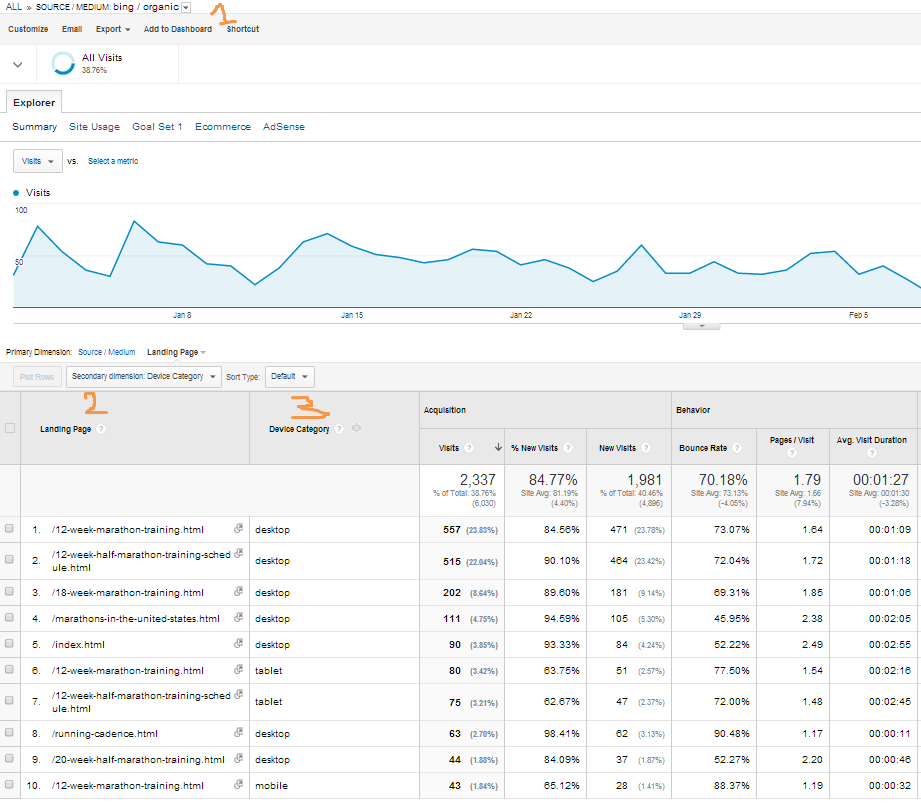
This is how the report looks like:
Wow, look at that!
We have drilled down into bing / organic and can see how different landing pages perform on the three device types. I hope by now you understand how effective these dimensions can be.
There are many more ways to segment your data. You could use advanced segments and view filters as well.
Regarding report segmentation, there is one more important thing: dimension filters.
Let’s assume you need the following dimensions:
- Bing / organic
- Landing page // includes “week”
- Device type // mobile and tablet
Two steps to set this up:
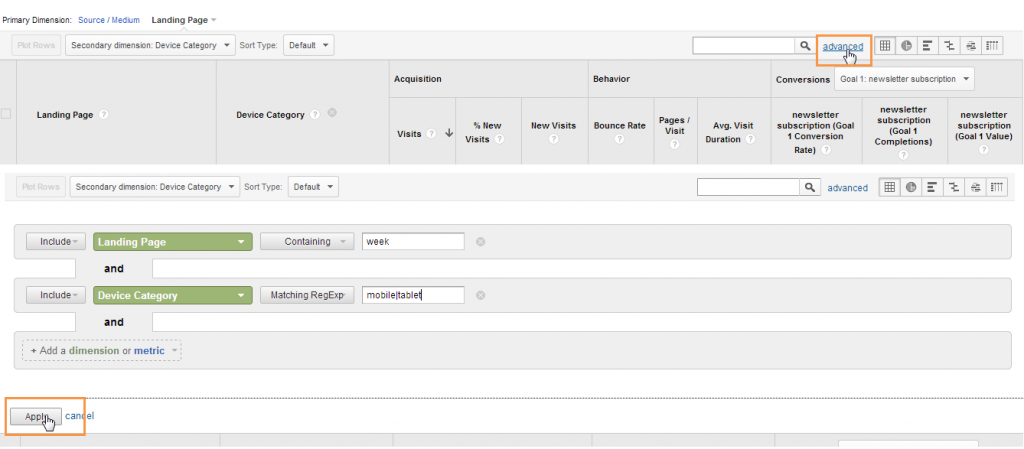
- Click on advanced (next to the primary dimension “search box”)
- Set up the right filters (regular expressions make things easier) and hit apply
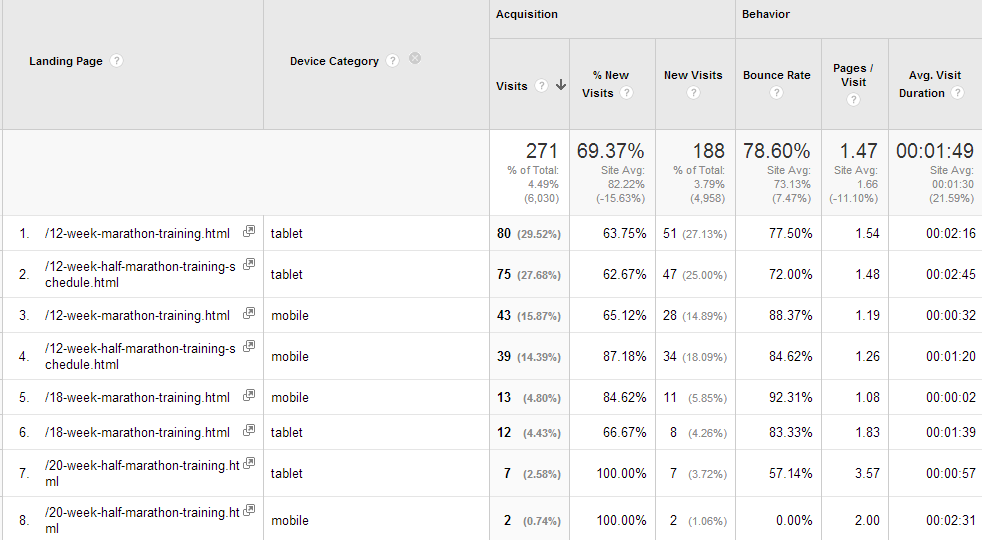
Here is the final report I like to show you:
I hope everything is clear so far. Are you already migrated to Universal Analytics? Great, I have one more secret to share with you!
Custom Dimensions
With Universal Analytics (since November 2013 GA product update) you are now able to define you own custom dimensions. This in addition to all the available standard dimensions in Google Analytics.
This is great since each business is different.
In order to get even more out of your secondary dimensions, I suggest that you experiment with custom dimensions.
Two more resources you wouldn’t want to miss:
This is it! I believe that secondary dimensions are very powerful. What do you think? Do you have a list of favorite uses?
One last thing... Make sure to get my automated Google Analytics 4 Audit Tool. It contains 30 key health checks on the GA4 Setup.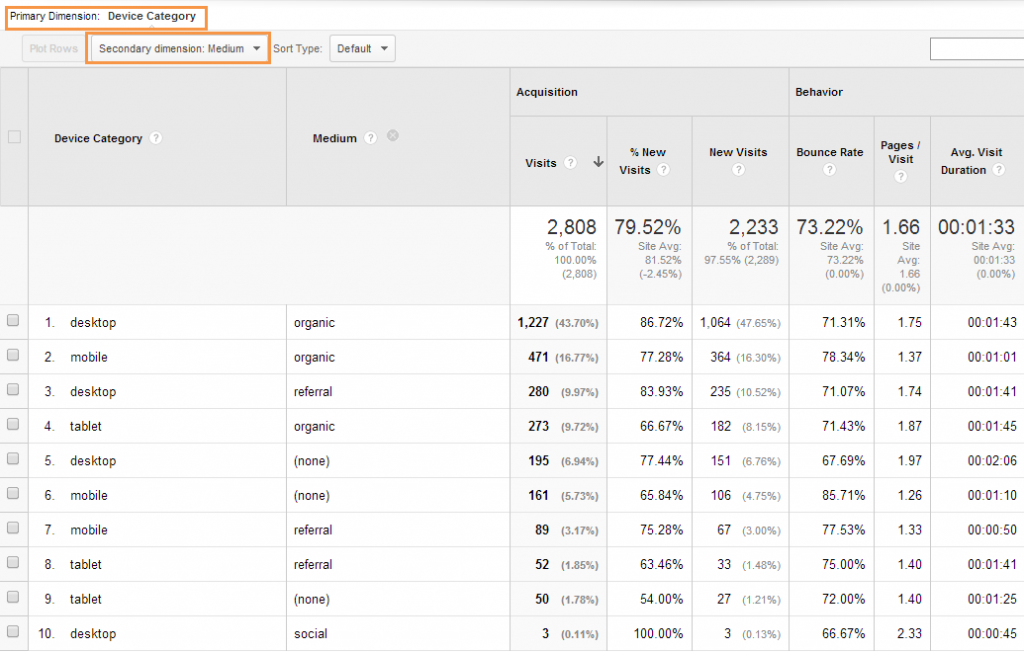
Leave a Reply