Having products out of stock is one of the worst things that can happen for Ecommerce websites. In this blogpost you learn how to measure and analyze out of stock data in GA.
I have worked with many Ecommerce businesses in the last years. In my experience, “out of stock” issues are quite common among online retailers and can have a big negative impact on sales and brand image.
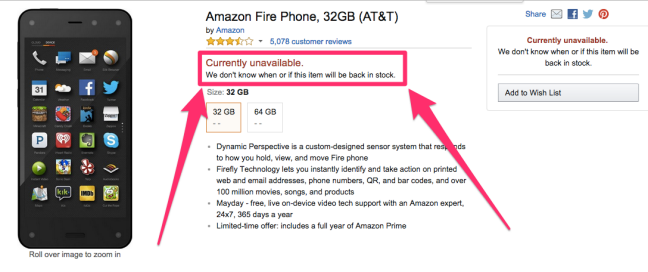
First, I will start with a quick general introduction and after that we dive deep into the Google Analytics implementation and analysis.
I recommend reading the entire article from start to end, but you can skip the introduction if you really want to.
Note: some of the links on this page are affiliate links. Link to affiliate disclosure.
Table of Contents
- Introduction Out-of-Stock Issues
- Data Requirements Enhanced Ecommerce
- Product-Scoped Custom Dimension
- Product-Level Analysis
- Three Segments for Conversion Analysis
- Out-of-Stock Sessions Analysis
- Ecommerce Data
- Conversion Rate Trends
- Factor and Revenue Impact
- Concluding Thoughts
Let’s dive right in!
Introduction Out-of-Stock Issues
You will be ok if you run a large Ecommerce website and have just a few products out of stock that are not really popular. But, having multiple popular products out of stock can quickly turn into a real problem.
Here are the three most common scenarios:
- The product is permanently out of stock.
- The product is temporarily out of stock.
- The product is expired.
The most common scenario that I encounter is #2: one or more products are temporarily out of stock.
Here is a list of common responses from consumers:
- She switches from Ecommerce platforms to buy the same item from another retailer. And even worse, she switches brands entirely.
- A negative impact on store and brand image especially when a product has been heavily advertised or promoted.
- Loyal customers might substitute a different size or variety of the same product.
- Loyal customers not in dire need will possibly wait to buy the item later when it is back in stock.
- Customers encountering an out-of-stock item before or even after they have added items to their cart may abandon the site altogether, including removing other items that were already in the cart.
Hopefully enough reasons to take this very seriously. Now I will show you how to collect relevant data into Google Analytics!
Data Requirements Enhanced Ecommerce
First of all, you need to get the “basic” Enhanced Ecommerce implementation right.
Review this set of Ecommerce articles to get an in-depth understanding of Google Analytics and Ecommerce.
I recommend splitting the implementation of Enhanced Ecommerce in (at least) two different phases. Also, we want to work backwards when implementing this feature. You can review the image below:

Image courtesy: Google Tag Manager Course for Intermediate Users
Implementing the different items of phase one is required for an in-depth “out of stock” products analysis.
This is because the availability of products is usually shown/measured at the product detail level. Some online retailers also implement this feature on gallery pages (product listing), but in this analysis we will solely focus on product detail pages.
Product-Scoped Custom Dimension
I have written a thorough guide on using Custom Dimensions. Make sure to read it if you are not familiair with them.
Availability (In Stock and Out of Stock) is categorized as a product-level Custom Dimension.
Make sure to follow this rule:
“Product-scoped Custom Dimensions are per-product-per-hit metadata that you need to send with the Enhanced Ecommerce payloads.”
Here is an example of an Enhanced Ecommerce dataLayer.push that contains the Custom Dimension “Availability” in slot #3:
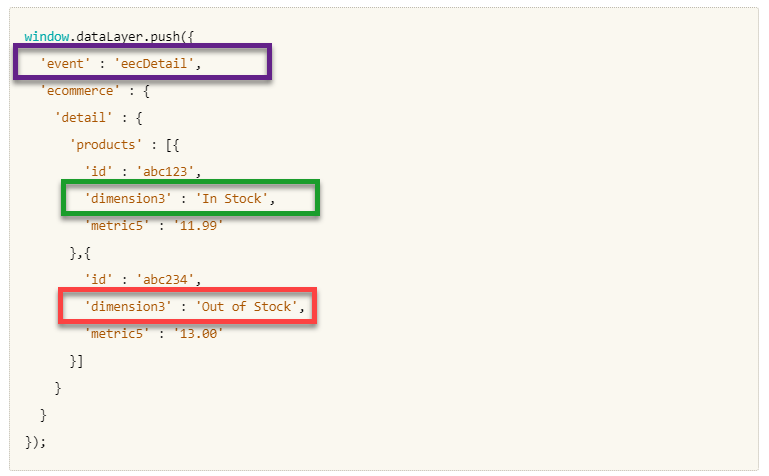
In this case, the visitor is exposed to two different products of which one is in stock and the other out of stock. Embedding the dimensions in this way, will ensure that Google Analytics can pick them up correctly.
There is one more thing you need to set up in the Google Analytics admin section (property level):
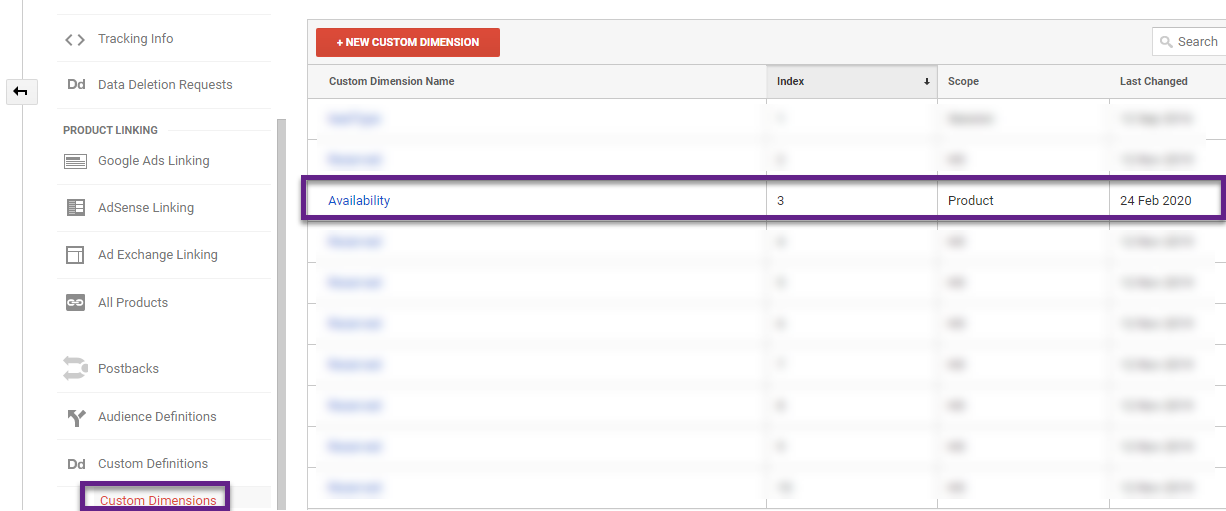
Make sure to match the index number and set the scope to “Product”.
Product-Level Analysis
Now it’s time to dive into the first product-level analysis based on this new data collected in Google Analytics.
You will learn how to perform an analysis via Google Sheets and Supermetrics.
—————————————————-
Note:
I recommend setting up two Custom Metrics if you want to perform an analysis inside of Google Analytics.
- Custom Metric 1: captures the product detail view when a product is out of stock. // required
- Custom Metric 2: captures the product detail view when a product is in stock. // optional
By doing this, you can define a calculated metric that shows out of stock (OOS) percentages for products (name or SKU) directly in Google Analytics.
—————————————————-
Custom Report for Testing
It’s always great to test with certain metrics and dimensions in Google Analytics or via the query builder first.
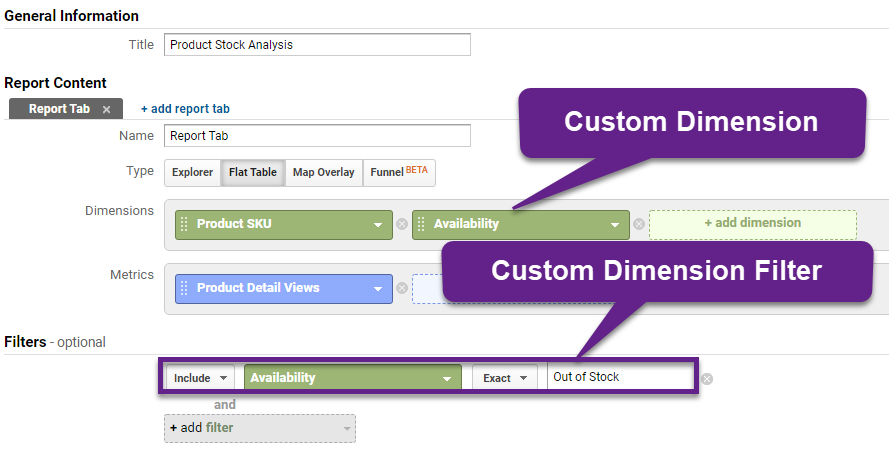
Here is one example of a report that contains two dimensions and one metric:
- Dimensions: Product SKU and Custom Dimension “Availability”.
- Metric: Product Detail Views.
Report Setup
Report Data
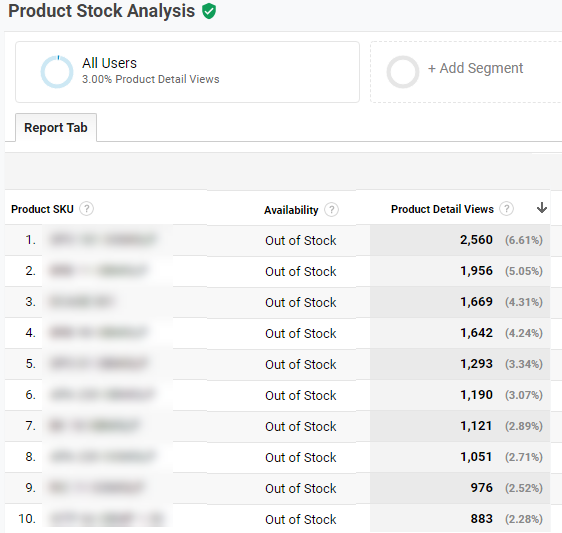
You can create a similar report based on the “Product Name” dimension. By doing this, you already verify that it is possible to combine this set of dimensions and metrics in and outside of Google Analytics.
Google Sheets and Supermetrics
The great thing is that – even without the setup of Custom Metrics – you can make a detailed, automated analysis of OOS percentages at the product name or SKU level in Google Sheets.
There are various ways on how to accomplish this, but I recommend using two tools:
- Google Sheets
- Supermetrics (link to Google Sheets add-on)
- *Google Analytics API // connecting “bridge”
*The Google Analytics API supports you in automatically extracting data from Google Analytics into Google Sheets (via Supermetrics).
Ok, let’s get started with the first step. I will take your through the complete setup at the Product SKU level (you can replicate it on Product Name).
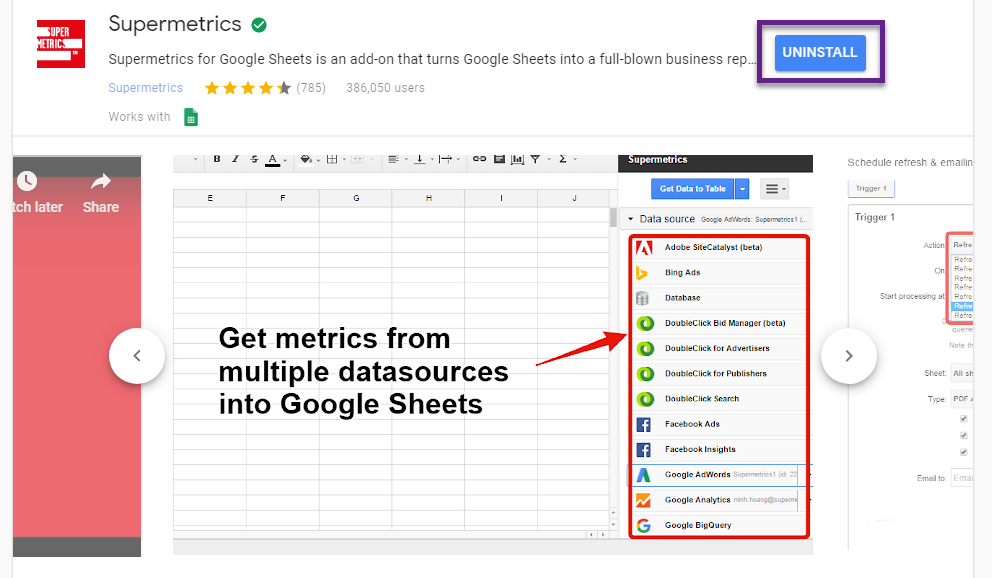
Step 1: install Supermetrics add-on on your computer.
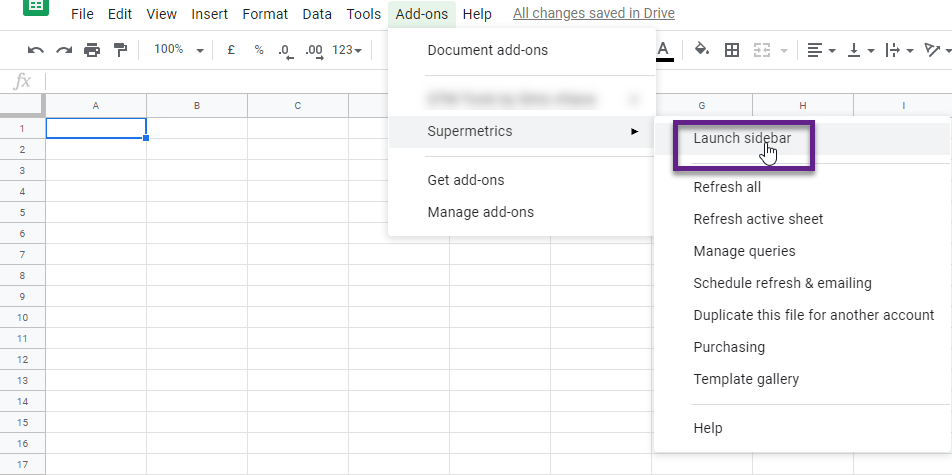
Step 2: launch Supermetrics inside Google Sheets.
Step 3.1: run first query on Product SKU and Product Detail Views.
Here is what you need to select in Supermetrics (first center your mouse on cell A1):
- Data source: Google Analytics.
- Select views: Google Analytics view where you want to pull the data from.
- Select dates: dates to run the query on.
- Select metrics: Product Detail Views
- Split by / rows: Product SKU and # rows to fetch (make sure to set high enough to pull all Product SKU data in Google Sheets).
- Options: try to avoid Google’s data sampling (only available if you are on a paid plan).
Click on “Get Data to Table”. It usually goes pretty fast! Great, you are now done with your first query.
Step 3.2: run second query on Product SKU, Product Detail Views and the related Custom Dimension.
First, to save time, go with your mouse to cell A1. Click on “Duplicate” (under query actions) and go with your mouse to cell D1.
There are only a few changes that you need to make within the query builder:
- Split by / rows: Product SKU and Custom dimension [ID] that corresponds to “Availability” Custom Dimension.
- Filters: Custom dimension [ID] equals “Out of Stock”. // change name if you have named the value differently.
Click on “Get Data to Table”. Great, you have now all data in Google Sheets. It should look somewhat similar to the below:
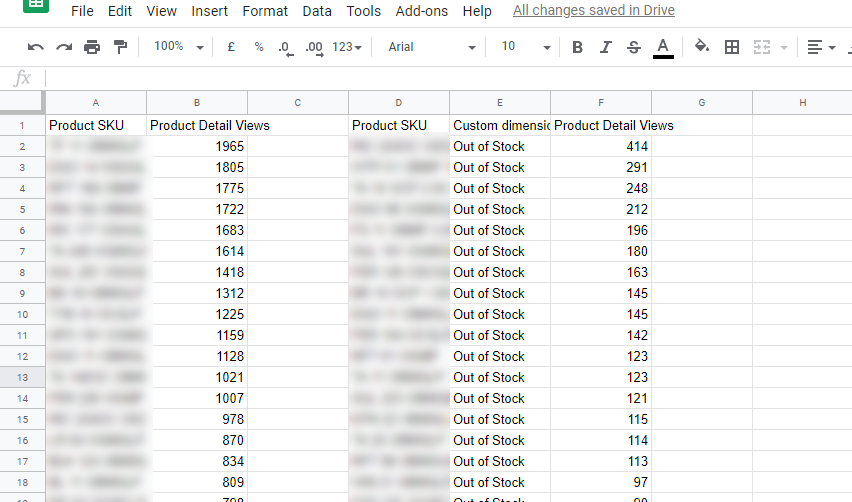
This sheet serves as a Raw Data Sheet, you could name it as “RAW DATA PRODUCT SKU”.
Step 4: match the two queries so that you can calculate Out of Stock percentages at the product level.
One quick and easy way to get this done is by using the VLOOKUP function.
An example is shown below:

Please review this video below if you need more information on how VLOOKUP works:
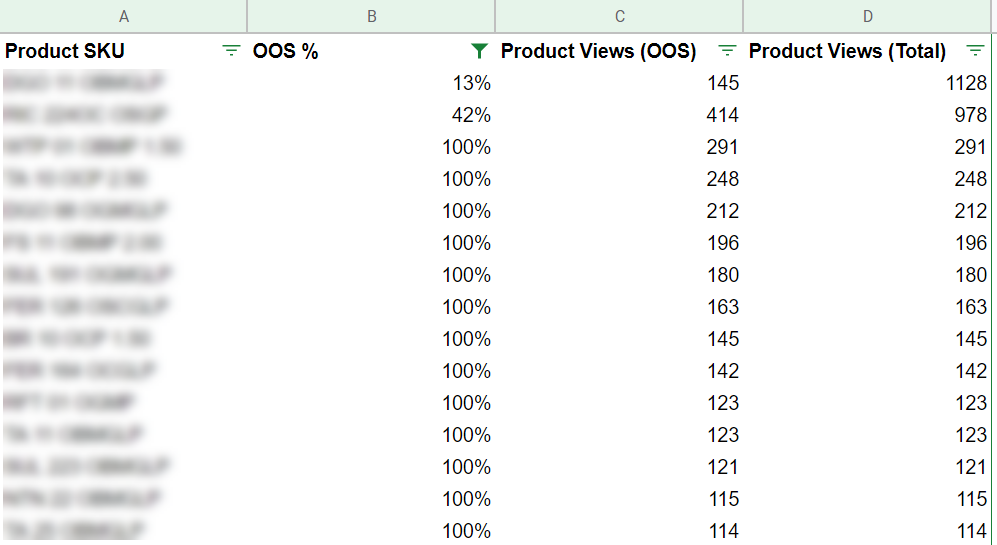
Here is an example of a setup to review Out of Stock percentages of different products:
Step 6: get insights from your data and act on it.
You might be able to answer all kinds of questions with this new data:
- How much money are we spending on marketing campaigns to drive visitors to out of stock products?
- Which of our customers (e.g. identified via User ID) wanted products that were out of stock?
- Can we retarget those customers via e-mail when stock is replenished?
There is simply so much value in this data!
Note: you could add product revenue/amount metrics as well, but be careful when interpreting them!
BONUS: automate it!
Ok, this is going beyond the goal of the tutorial, but if you have the (internal) knowledge of Google Sheets and advanced functions, you can definitely automate a lot of things here.
- Periodically and automatically pull the data from Google Analytics.
- Create automated charts for your data set.
- Set up automated custom alerts that inform you when values cross a certain barrier.
Make sure to set up your reporting needs and talk to a technically skilled person to get the job done!
Three Segments for Conversion Analysis
In addition, we can also make an analysis at the aggregated level. I recommend creating the following Google Analytics segments:
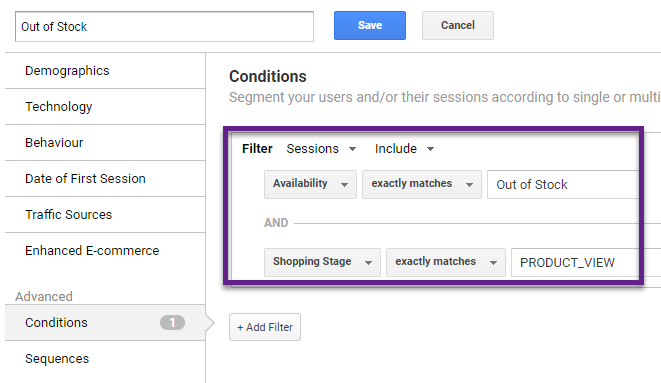
- Sessions with out of stock product views.
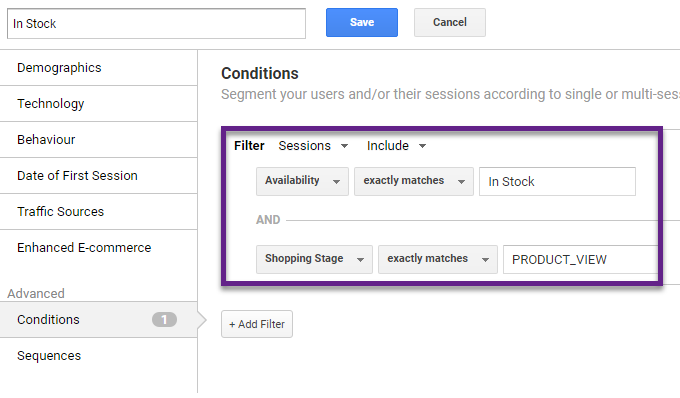
- Sessions with in stock product views.
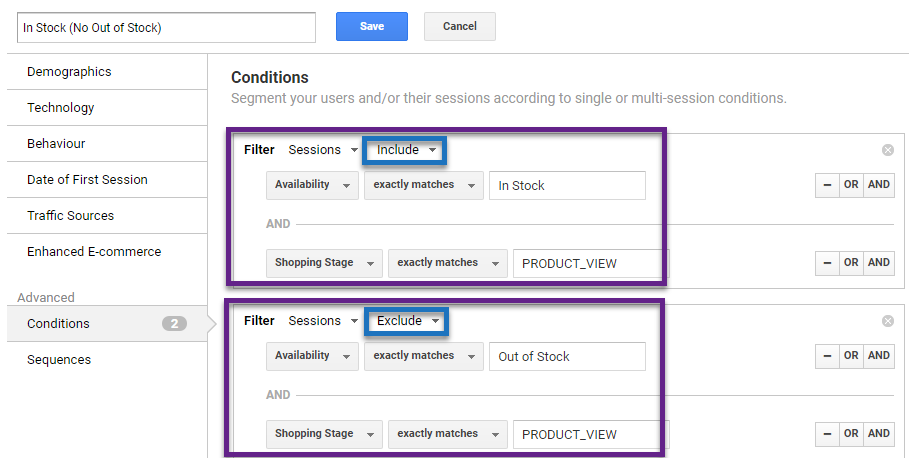
- Sessions with in stock and without out of stock product views.
Out of Stock Segment
In Stock Segment
In Stock (no Out of Stock) Segment
Out-of-Stock Sessions Analysis
Let’s dive into an out-of-stock traffic analysis. Again, we can use Google Sheets with Supermetrics.
Sessions (absolute)
Here is what you need to select in Supermetrics:
- Data source: Google Analytics.
- Select views: Google Analytics view where you want to pull the data from.
- Select dates: dates to run the query on.
- Select metrics: Sessions.
- Split by / rows: Year & Month.
- Segment: Out of Stock.
- Options: try to avoid Google’s data sampling (only available if you are on a paid plan).
And here is an overview of sessions (monthly basis):
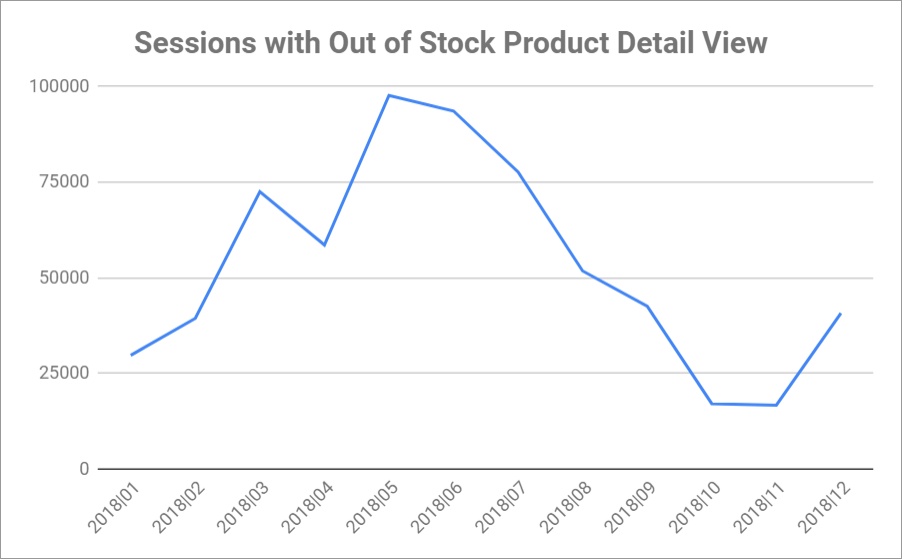
There is a clear peak in May and June. But, this doesn’t tell the whole story.
What if these months simply have more traffic in general? That’s why we need to go one step further and calculate relative percentages per month.
Sessions (relative)
Add another query to Supermetrics to get the job done (only difference is that the segment includes all sessions with product detail views):
- Data source: Google Analytics.
- Select views: Google Analytics view where you want to pull the data from.
- Select dates: dates to run the query on.
- Select metrics: Sessions.
- Split by / rows: Year & Month.
- Segment: PDP Sessions.
- Options: try to avoid Google’s data sampling (only available if you are on a paid plan).
Now you can use both data sources to calculate percentages and turn them in a chart:
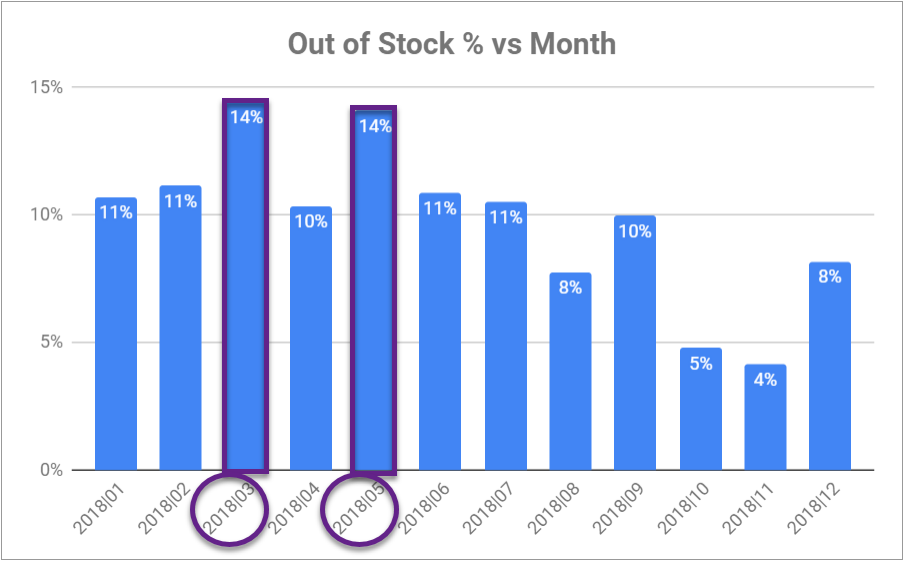
For this website and online retailer, March and April (2018) had relatively a high percentage of sessions where visitors encountered a Product Detail page with a product was out of stock.
Ecommerce Data
How do out of stock and in stock sessions correlate to sales? This is when you need to apply segments in Google Analytics.
Here is an overview of one year’s Ecommerce data:
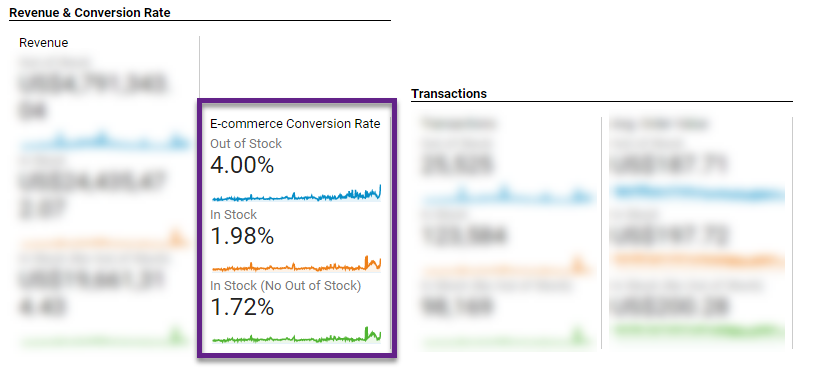 In this case, the sessions where a visitors encountered an out of stock product, resulted in a substantially higher conversion rate.
There can be several explanations and one of the reasons is that those visitors in general compare more different products before eventually purchasing. They are really “shopping” on the website.
The “in stock (no out of stock)” segment CR% is relatively close to the “in stock” segment.
Here is another overview to give you some context in terms of user behavior:
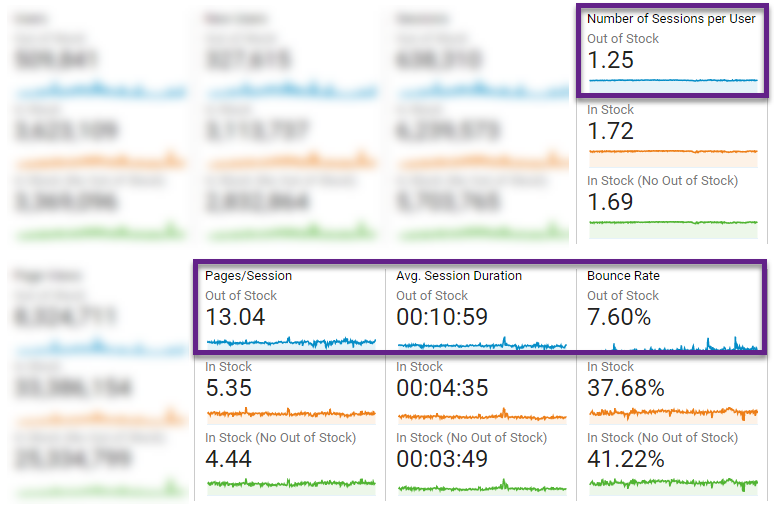 Clearly a different segment in terms of user behavior!
In the next section I will show the monthly Conversion Rate trends in 2018 for both the “out of stock” and “in stock” segment.
Conversion Rate Trends
I have used the Google Analytics API, Google Sheets and Supermetrics to create the chart below:
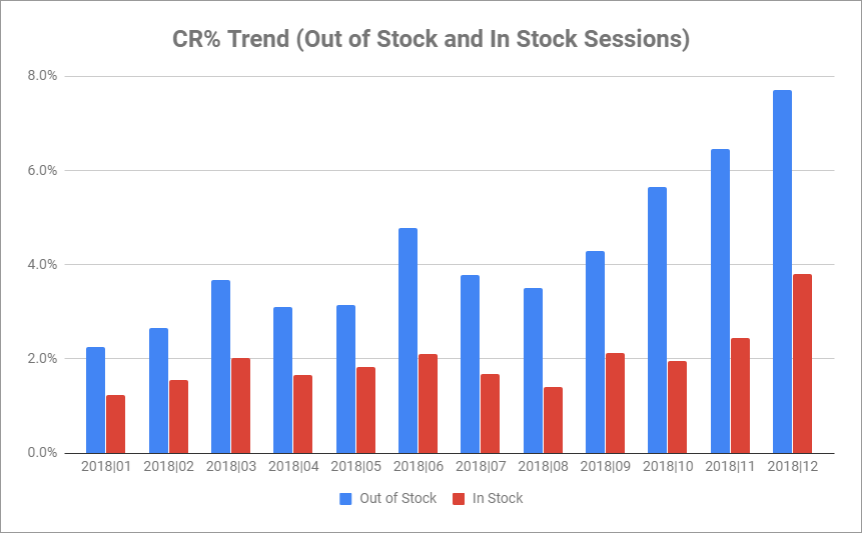
- Be aware of potential sampling challenges if you have a high traffic website. The paid version of Supermetrics will mitigate that.
- In 2018 there are large differences in Ecommerce CR% on a monthly basis.
- Absolute and relative differences are greater for out of stock sessions.
- Relative differences of CR% (out of stock / in stock) also vary per month.
- In general, there is a correlation between months with low overall percentage of out of stock sessions and Ecommerce CR%.
- Ecommerce CR% is higher in months with a relatively low amount of out of stock sessions.
Factor and Revenue Impact
In this section you will learn some strategies on how to perform a missed revenue analysis in case of out of stock.
We will look into two types of analysis:
- Product Level Revenue Analysis.
- Aggregated Revenue Analysis.
Product Level Revenue Analysis
At the product level, you can calculate potential lost revenue for certain products based on these factors:
- Total product detail views of a certain product / variant // make sure to capture product views of all variants
- Total product detail views of a certain product with “out of stock” label.
- Price per product/variant.
I recommend working with product SKU instead of product name. The “product name” dimension usually aggregates different product SKUs of which some might be in stock and others out of stock.
You can perform this analysis in Google Analytics (use calculated and custom metrics) or in Google Sheets or different application.
Aggregated Revenue Analysis
But what if your company/client asks you to do an overall transaction/revenue analysis?
There are many ways to address this question and it can get really challenging to come up with reliable data insights.
Let me explain one way of looking at potential missed revenue.
You need to work with factors. The factor shows the relative differences in Ecommerce CR% per month between the out of stock and in stock segment.
Here are some data points based on the chart under “Conversion Rate Trends”:
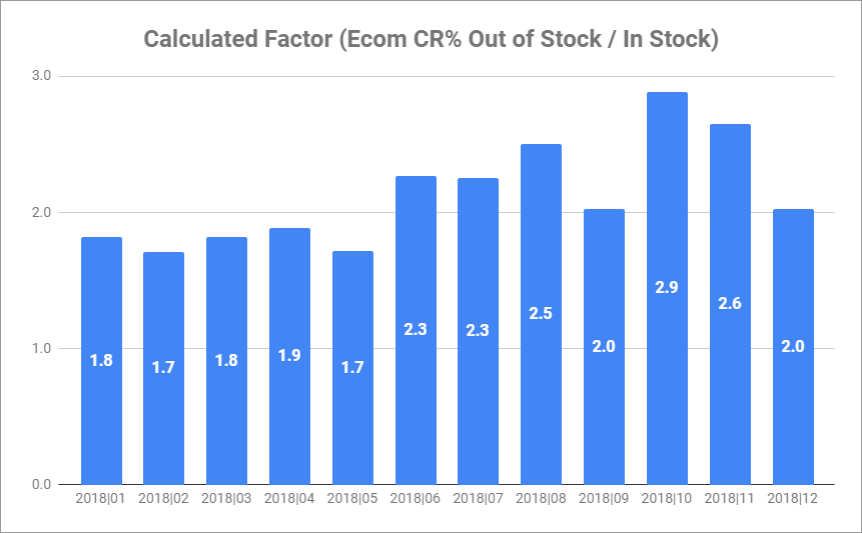
- It is very common that low factors correlate to periods with high percentages of out of stock sessions.
- In this case, March and May 2018 have the lowest factor and very high percentages out of stock sessions.
Missed Revenue Calculation (Example May 2018)
A few details are shown below:
- Assumption: Out of Stock doesn’t impact In Stock numbers/percentages.
- Factor in May 2018 equals 1.7.
- What if the calculated factor would be 1.8, 1.9, 2.0 etc.?
- Average factor equals 2.0 (based on 2018 dataset).
- Baseline revenue is $700,000. // this is total transaction revenue “out of stock” segment
I have created this chart based on the information above.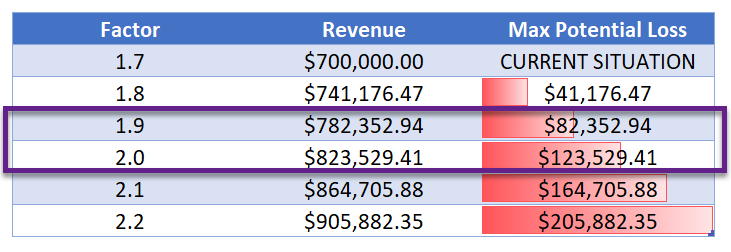
- We would see a $40,000.00 increase in revenue when the expected factor would be 0.1 higher in a certain period of time.
- We estimate our transaction revenue loss to be approx. $100,000 if in May 2018 the expected factor would be between 1.9 and 2.0 (instead of 1.7).
Based on these calculations, we can conclude that having products out of stock can dramatically impact your revenue numbers and bottom line.
And, as I already stated in the introduction, there is much more at stake when you are dealing with high percentages of out of stock products!
Concluding Thoughts
Having products out of stock can be a real nightmare. Your revenue and brand image are at stake if you don’t deal with it in a proper way!
Very often, Ecommerce businesses have inventory systems where they can run a query to see which products (SKUs) are out of stock.
Where they are lacking is connecting it to Analytics, customer behaviour and sales. This is where Analytics comes in scope.
In this blogpost I have shared several strategies to measure and analyze out of stock data both at the product as well as aggregated level.
It’s not an easy exercise, but in my opinion definitely worth exploring further!
Now it’s you turn!
Do you currently measure product availability for your company or clients in GA? And what are your thoughts on analyzing this data in Google Analytics?
One last thing... Make sure to get my automated Google Analytics 4 Audit Tool. It contains 30 key health checks on the GA4 Setup.
Hi
Thank you for the blog, its very helpful. I have a question, my website uses shopify plus and enhanced ecommerce is already enabled. The information on the product detail page (details on the product such as category, price, colour etc) is already being pushed but not via GTM. However in your step where data.Layer push contains the dimension and the value, does that needs to be hardcoded separately ? or there is another way for Shopify webistes? I am not sure how the data is pushed, it just says in the console that “This event was not sent by GTM”
Thank You
Thank you for reaching out. I don’t have specific Shopify experience, but yes, you would need to do the dimension setup hardcoded (separately) if you can’t implement it via GTM / Data Layer. Most probably you need the help of a developer to get the work done.
Thank you so much for your prompt reply. Much appreciate.
Hi,
We’ve sent this to our developer and they’ve made sure to send availability data via the data layer. Is it necessary to name the availability metric ‘dimension[3]’ in the data layer or can it be something else (e.g. stock)?
I’m asking this because we’re now seeing that our data is marked up a bit differently;
Just under products (ecommerce > detail > products), we’ve got information about product name, id, price, brand, category and stock. Stock is the ‘closing metric’ on every productpage. Can I conclude that I need to select dimension 6 in Analytics (seeing as there are five other metrics also sent via the data layer)?
Thanks in advance!
Hi Liam,
Please note that “availability” is a Custom Dimension (not a metric).
You can use slot #1 if you haven’t set up Custom Dimensions yet. Otherwise, you would need to use the next free slot.
As mentioned in the article, you also need to set it up in GA (under property).
Hope this helps!
I cannot subscribe. I have used 3 different emails and I am not getting the link
Hi Fionn,
Please send me a quick email on paul@online-metrics.com and I will follow up from there if you are still having troubles.
Best,
Paul