The (other) row in Google Analytics 4 can be a real pain. In this new blogpost you will learn several strategies to avoid this issue as much as possible.
Google Analytics 4 has – as far as I can tell – an unspecified cardinality limit on the underlying data tables accessed via the GA4 UI or data API. This to reduce the data processing cost on their end.
When you use a high-cardinality dimension (a dimension with many potential different values) or multiple dimensions, the underlying data table can hit the unspecified row limit. This causes any data past the row limit to be reported under the (other) row in GA4 reports.
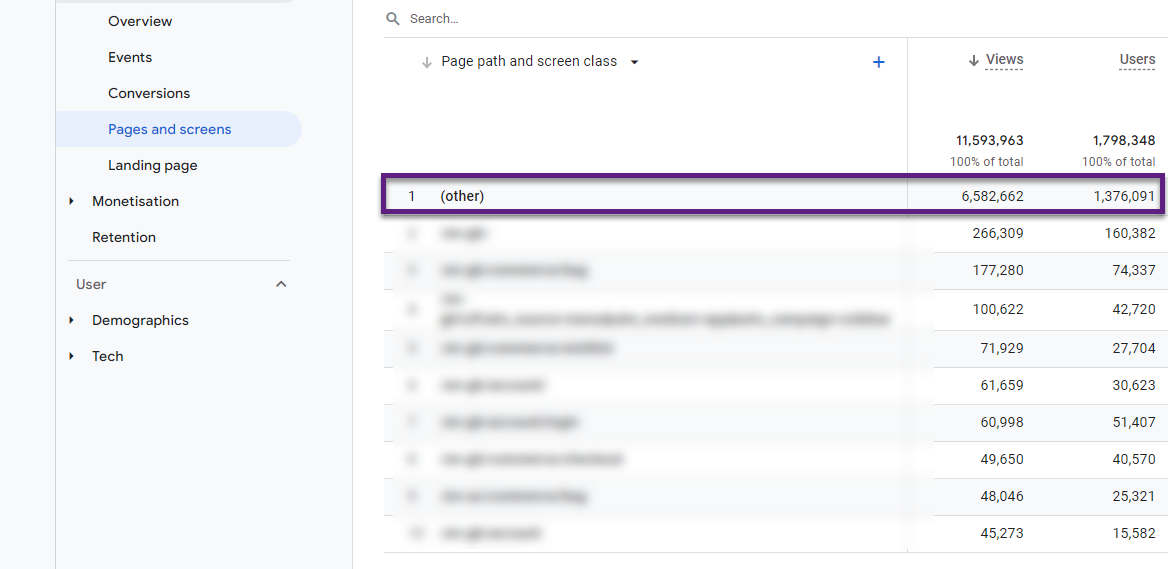
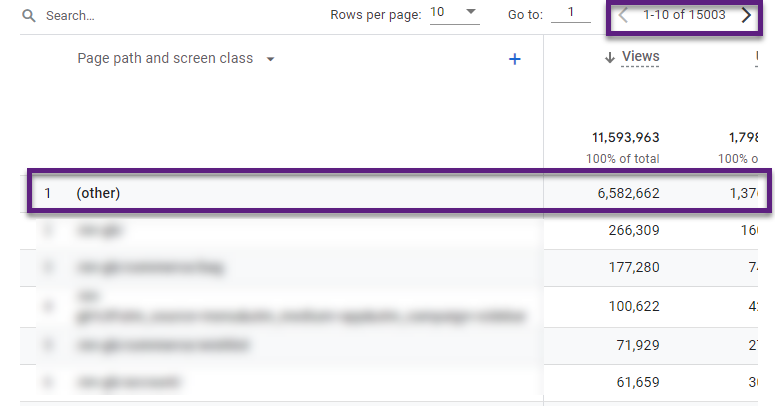
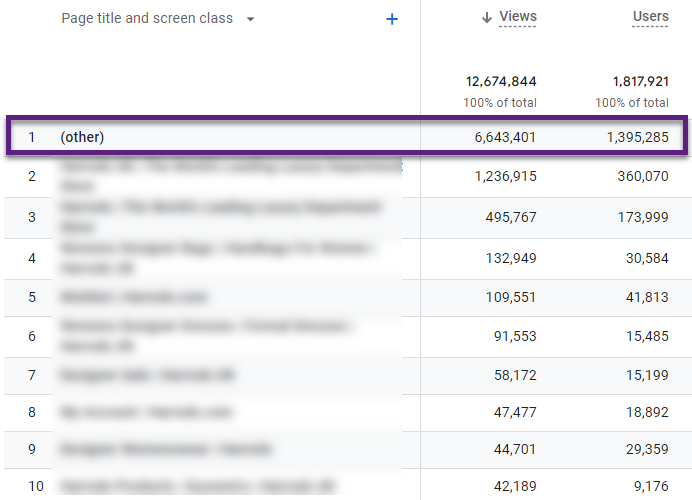
Over 50% of the pageviews are grouped into the unknown bucket (other); can you imagine the negative impact on your data quality?
The rest of this article contains more background information on (other) and cardinality as well as actional steps to reduce the impact on your data.
Table of Contents
- GA4 and Three Data Tables
- (other) in GA4 Reports
- Cardinality in Google Analytics 4
- Eight Ways to Minimize (other)
- Concluding Thoughts
Let’s first start with some background notes on data tables in GA4.
GA4 and Three Data Tables
The first data table is the one you are most familiar with. This one is visible in the reports in the GA4 UI or via the data API.
The next or second data table contains processed and aggregated data instead of raw event and user-level data. This underlying data table you can’t see and it produces the data table that you see in reports in the GA4 UI or via the data API. In general, this second data table also ‘feeds’ many other dimensions that are not visible in your report.
And then we have the third type of data table. It is the one containing raw event and user-level data. You can review this type of data table via the Exploration reports in the GA4 UI or via BigQuery.
Later in this post we will discuss the value of BigQuery in this respect.
(other) in GA4 Reports
In the introductory report there is a dimension where over 50% of the ‘page path’ values are grouped into the (other) row. This can be higher or lower, depending on many factors.
The impact varies based on dimension type, the amount of data collected and the total number of unique values. Also, one report can affect the outcome of another report.
Here is an example of a landing page report where you see a relatively low amount of views grouped into the unknown (other) bucket.
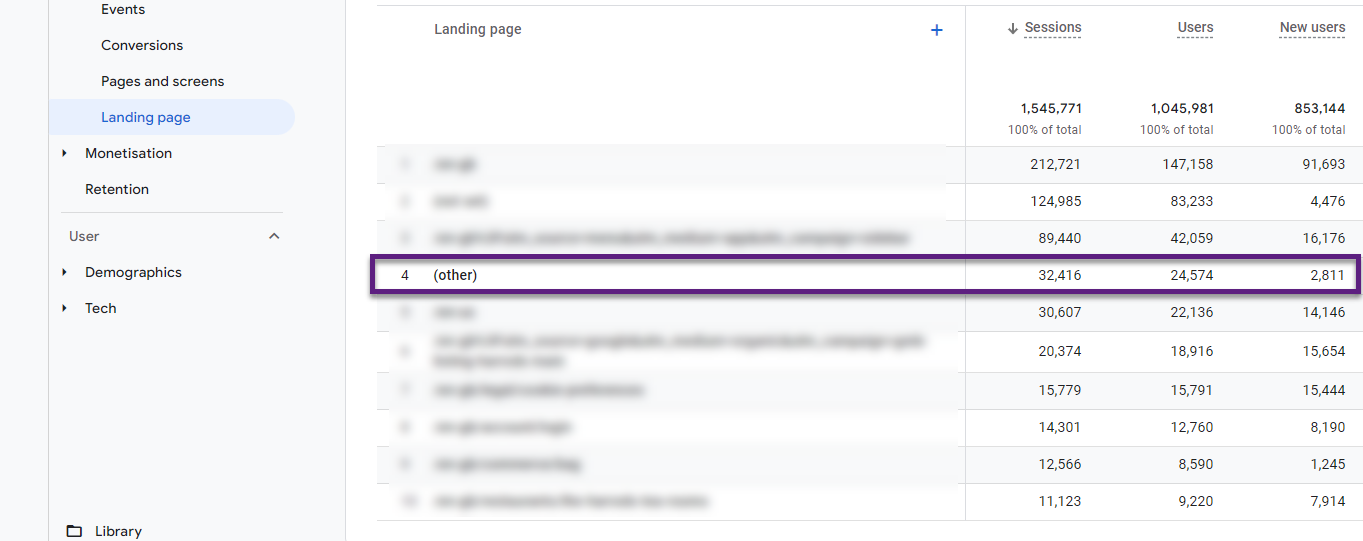
To recap, this is what it means when you see a dimension with value ‘(other)’:
- A lot of unique values are grouped together and GA4 doesn’t report them as individual rows, but under the same ‘(other)’ value instead.
- You lose the ability to analyze the values under the (other) row.
This is a serious issue as it prevents you from accurately analyzing your full data set.
Let’s discuss ‘cardinality’ now as it helps you understand why this happens in Google Analytics 4.
Cardinality in Google Analytics 4
Cardinality refers to the number of unique values assigned to a dimension.
There are dimensions with a fixed number of unique values:
- Device dimension can have three values – desktop, tablet, mobile. In this example, the cardinality equals three.
- Logged-in (custom) dimension might have two values (boolean) – true or false. In this example, the cardinality equals two.
The two dimensions above will never cause any issues.
But what about Page path, Page location or (custom) User ID? These dimensions can have thousands (or many more) unique values.
“In Google Analytics 4, a high-cardinality dimension refers to every dimension that records more than 500 unique values per day.”
Many factors determine whether or not the (other) row appears in your reports:
- Analytics 360 properties have higher limits when compared to the limits for standard properties. The exact limits vary depending on the following other factors.
- The individual report: i.e. the Pages and screens report have higher-cardinality dimensions, and therefore have higher limits.
- The report and complexity: a standard report with one dimension is rarely affected by an (other) row. Reports with secondary dimensions, filters, or comparisons are more likely to include an (other) row. These reports need database tables with many dimensions causing properties with large and complex data more likely to exceed the cardinality limits.
Eight Ways to Minimize (other)
There are several things you can do to reduce (other) and there is only one real solution to this issue.
- Use the BigQuery Export
- Exclude URL Query Parameters
- Avoid High-Cardinality Dimensions
- Use the Standard GA4 UI
- Use GA4 Explorations
- Avoid Data Sampling
- Upgrade to GA4 360
- Use Epanded Datasets
1. Use the BigQuery Export
The best way to avoid having ‘(other)’ and to analyze large datasets (past the sampling limits of GA4 Explorer) is to use the BigQuery export.
The BigQuery export provides access to the raw event and user-level data. BigQuery data tables do not suffer from cardinality or data sampling issues.
A couple of related advantages:
- Avoid data retention issues and keep your user-specific data as long as you need.
- Access unsampled raw event and user-level data.
- Take ownership of your data.
- Manipulate GA4 data in anyway you need.
- Integrate GA4 data with many other data sources.
2. Exclude URL Query Parameters
Excluding unnecessary query parameters greatly reduces the cardinality of dimensions related to page measurements in Google Analytics 4.
It doesn’t completely resolve the issue (in some cases), but it will be a great help.
The video below clearly outlines how to get this done via Google Tag Manager.
In general, I recommend to not exclude the following parameters:
- Site search query parameters
- UTM parameters in GA4
- gclid and other advertising click IDs
- Query parameters that are added to ‘confirmation’ page URLs
3. Avoid High-Cardinality Dimensions
It’s a best practice in relation to (other) and cardinality to avoid using high-cardinality dimensions in your report.
Registering custom dimensions as Event ID, Event Timestamp, Session ID or User ID can easily lead to cardinality issues. This will most probably lead to (other) row issues in your GA4 reports.
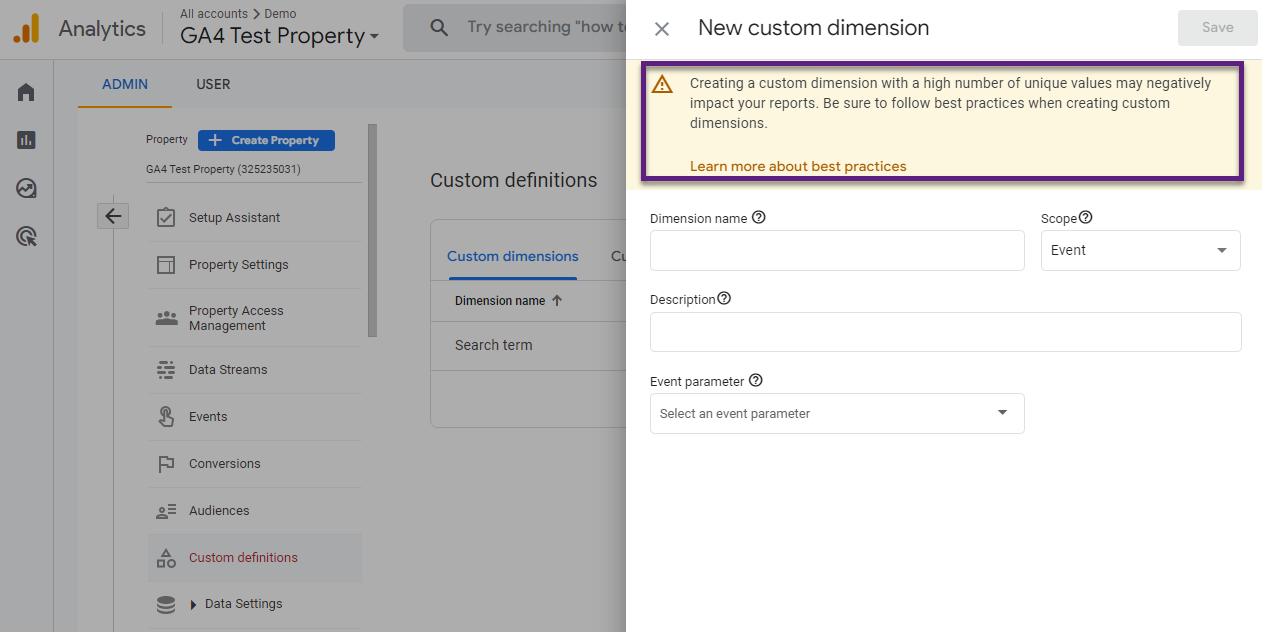
Google is already warning you about potential issues when you are about to create a new custom dimension.
4. Use the Standard GA4 UI
Use standard reports whenever possible.
Standard reports have aggregate tables that decrease the likelihood of condensing the data under the (other) row.
Unfortunately, applying several comparisons, filters and secondary dimensions to a standard report easily results in cardinality issues.
It’s a better option to create complex reports either via the Exploration reports and templates or via a BigQuery integration and report.
5. Use GA4 Explorations
As a rule of thumb, recreate your standard report via an Exploration if your standard report contains the (other) row.
But, a great downside is that you might suffer from sampling issues (example below).
Step 1: review the standard report in GA4.
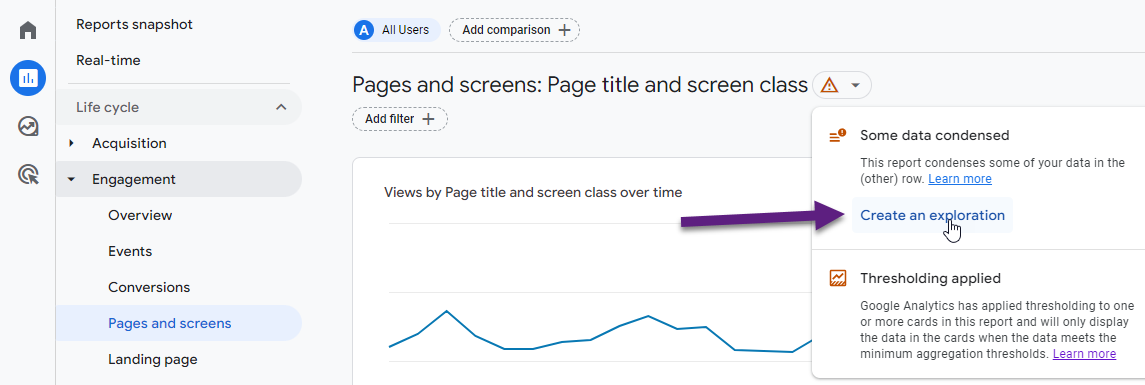
Step 2: at the top of the standard report, click on ‘Create an exploration’.
Step 3: review the Exploration and whether it is a solution in this case.
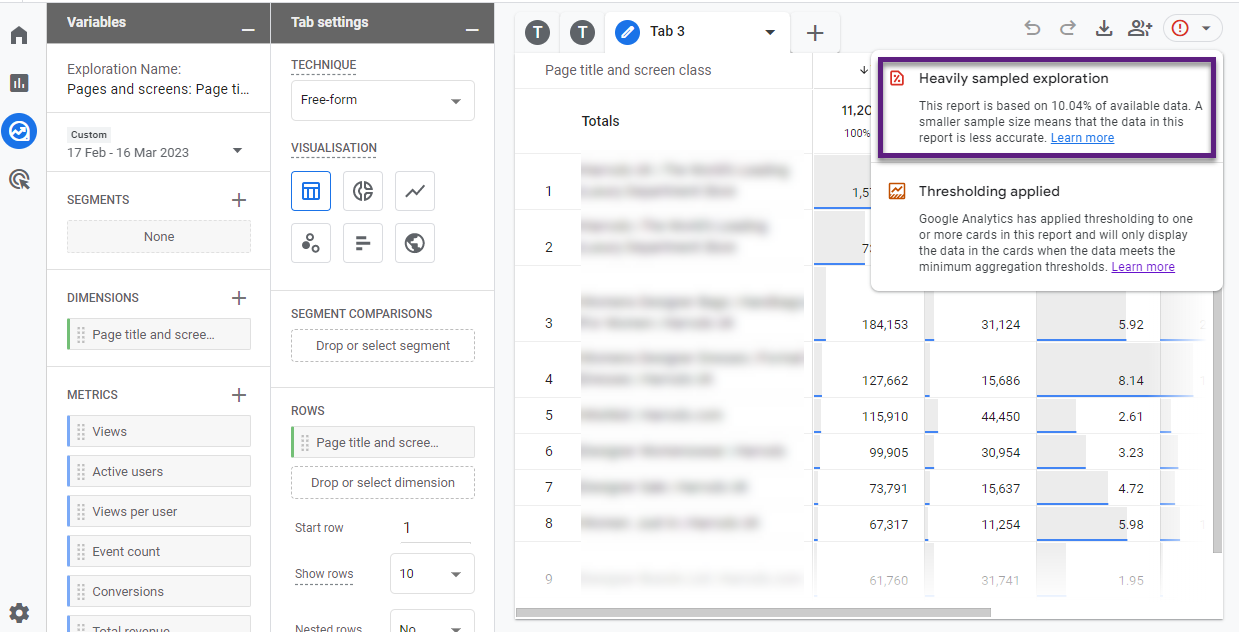
Think twice before using a similar report as above. The (other) row is gone, but the report might not be very accurate (based on 10% of available data).
In this case it is clearly not a solution to mitigate cardinality issues.
6. Avoid Data Sampling
Potential issues depend on the type of report you are using:
- GA4 UI standard reports: not subject to data sampling, but the (other) row is often visible when GA4 samples the data (in the background).
- GA4 Exploration reports: not subject to cardinality / (other) rows, but data sampling can be an issue. The reported data is greatly skewed in that case (as in the last example).
High-traffic websites can greatly benefit from migrating a GA4 property to GA360. This will help in minimizing or eliminating data sampling.
Read more: How Sampling Works in Google Analytics 4 (GA4).
7. Upgrade to GA4 360
Upgrading to GA4 360 isn’t for everyone, but it grants you with much higher sampling and cardinality limits if compared to the free version of GA4.
Data sampling
“The quota limit is 10 million events for users of the free Google Analytics product and up to 1 billion events for Google Analytics 360 users.”
Cardinality / (other) issue
“In GA4 most reports come with automatic custom tables enabled which means it is much less likely that you will suffer from the (other) row.”
Note:
Automatic custom tables don’t support all dimensions. Analytics 360 won’t use an automatic custom table and you will still see the (other) row in these cases:
- Attribution dimensions (including Default channel group)
- Session Conversion Rate (for one specific Conversion)
- User Conversion Rate (for one specific Conversion)
8. Use Expanded Datasets
GA4 360 properties have an extra option when they encounter the (other) row in the GA4 UI.
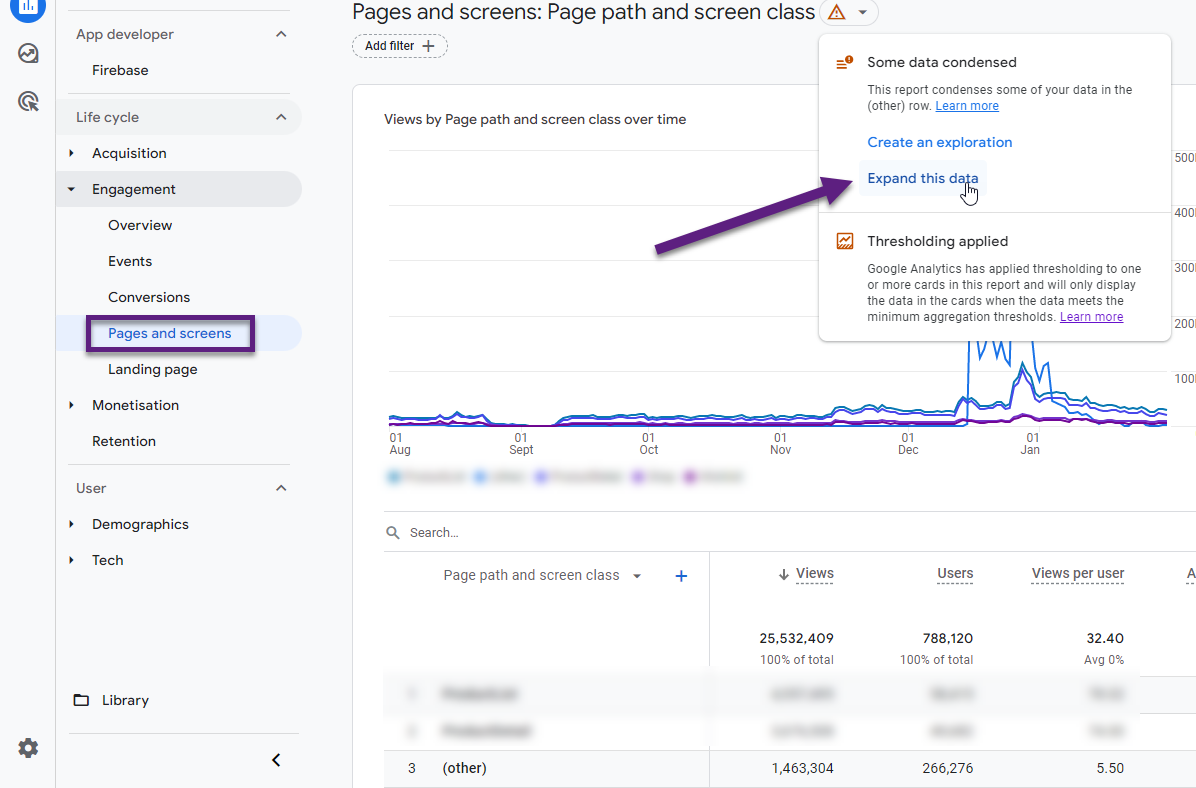
The ‘Expand this data’ option only appear for eligible reports.

Read more: [GA4] About expanded data sets for Google Analytics 360.
Concluding Thoughts
The integration of GA4 with BigQuery is your most powerful option. This is especially true if you are greatly ‘suffering’ from cardinality and (other) row issues.
But, as you have seen, there are several other strategies to mitigate the impact of cardinality on your data set.
At the end it comes down to your expertise, the volume of traffic and measurement requirements. These together will guide you in choosing your best option. Setting up and leveraging an integration between Google Analytics 4 and BigQuery is highly recommended, but not (yet) achievable for everyone.
Now it’s your turn. What is your experience with high-cardinality dimensions and data being aggregated under the (other) row in GA4? Happy to hear your thoughts!
One last thing... Make sure to get my automated Google Analytics 4 Audit Tool. It contains 30 key health checks on the GA4 Setup.
Limits of page_location and page_referrer (not to be forgotten!) can easily be mitigated with Ayudante’s “TrimQuery” GTM variable template although you must not exclude “srsltid” when enabling automatic tagging for organic Google Shopping results AKA “free listings” (but only when connecting Merchant Center accounts with GA4 and only if you want to detect Organic Shopping in its own channel). Still wondering why Google cannot exclude this (very long) parameter while they obviously can do this with gclid.
Problems with cardinality often arise with ecommerce standard reports, if you have many different products (not talking about variations). E.g. a report on a one-day-basis with less than 20.000 rows result in >95% of the revenue being attributed to “other”. Your only chance then is BigQuery or Explorations (and then having to report multiples of 500 by changing the starting row constantly).
Thanks for your comment Bernhard, great points!
Thank you for this article !
Short question about the 3 data tables: what’s the difference between 1 and 2? They both serve the GA4 UI and API, but the second one is aggregated? When do I see data table 1 in the UI, and when do I see data table 2?
Table 2 is the underlying table that populates the report. You don’t see this table in GA4. Hope this helps.