How much do you know about your visitor’s behaviour? Do you know how to effectively analyze navigation paths?
Google Analytics counts many different standard reports. And you have the option to build fully customized reports as well.
One of the “hidden” standard reports is the navigation summary report. In this article I will explain about:
- How to access the navigation summary report
- Why and when to use it
- How to interpret the numbers (most people get this wrong!)
Where to Find the Navigation Summary Report
You are probably used to finding your desired report on the left side of the Google Analytics reporting interface.
This specific report is hidden under another report.
-
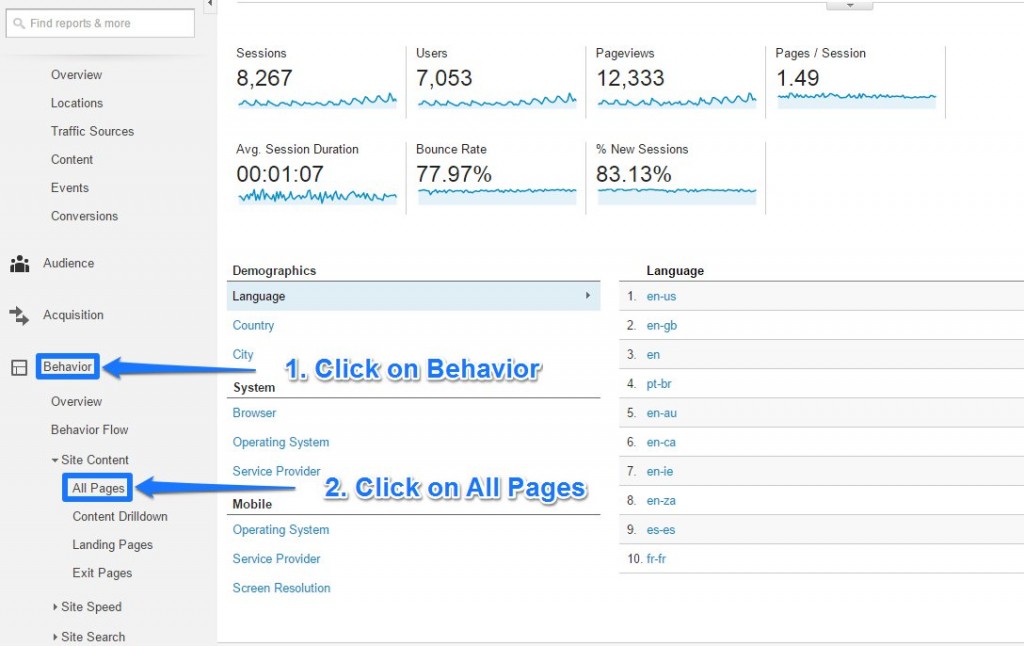
- Click on “Behavior section”
- Click on “All Pages”
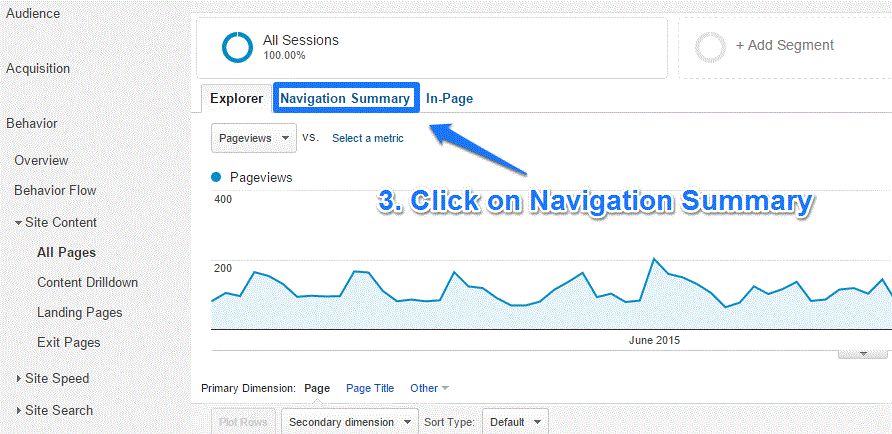
- Click on “Navigation Summary”
- Select the page you want to analyze (on default “homepage” is selected)
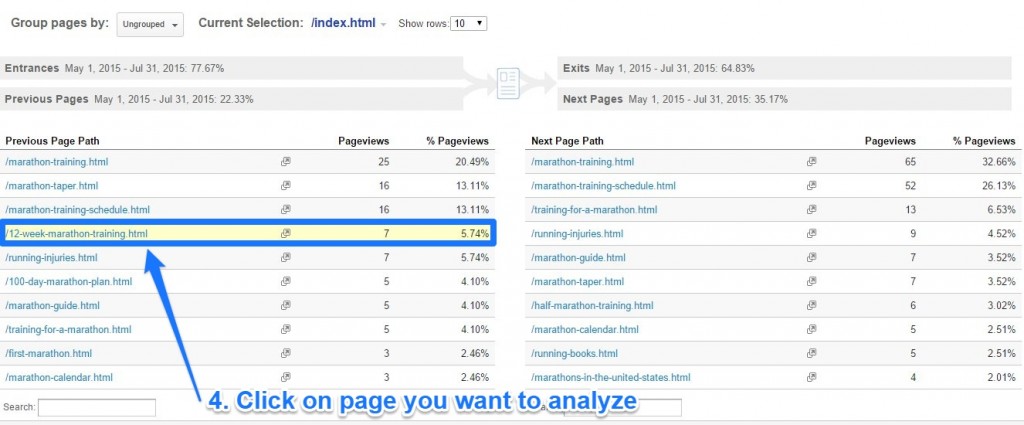 In this example the /12-week-marathon-training.html page will become the current page:
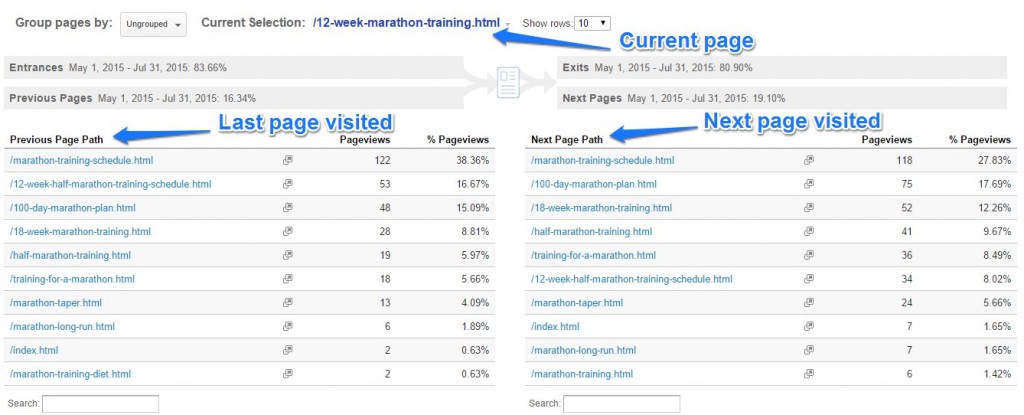
Why and When to Use This Report
Often I prefer to use the navigation summary report instead of in-page Analytics.
There are two mains reasons why I prefer this report over in-page analytics:
- I find in-page analytics reports often to be broken
- After using in-page analytics you need to delete your cookies, log out or take other steps to “close” this report
1. Extract Valuable On-Page Insights (Overall Level)
First of all it is interesting to find out how visitors actually navigate on your site.
And how the clicks are distributed over different areas.
- On a content site you can discover which internal links get the most clicks
- On an ecommerce site you can discover pogo-sticking behaviour (translated into clicking back and forth in the purchase funnel)
- On a leadgeneration site you can discover how many people click back from your leadgen form and to what page. This to get an idea on what information they are missing to fill in the form.
There are many more reasons why to use this report.
2. Extract Valuable On-Page Insights (Segmented Level)
You could also apply segments to your navigation summary overview.
An example is shown below:
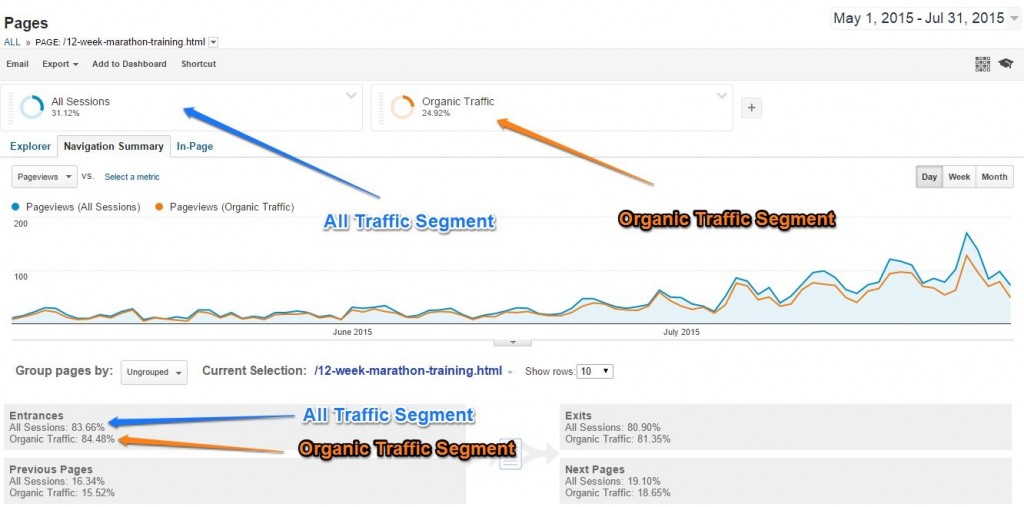
You could compare organic vs. paid search traffic. Or email vs. affiliate websites.
This gives you a better understanding of the clickstreams for each of your traffic channels or defined segments.
3. Evaluate A/B Test Campaigns
You might run your A/B tests in Optimizely, VWO, Test & Target or via Google Tag Manager.
In my experience you should not (only) trust your test tool data.
First of all this data might be less accurate. And besides that your web analytics tool can provide you with loads of extra information on visitor’s behaviour (not only conversions).
Make sure to send your test data into Google Analytics so that you can measure on-site behaviour as well.
You can use event tracking (article ConversionXL blog) to get this to work.
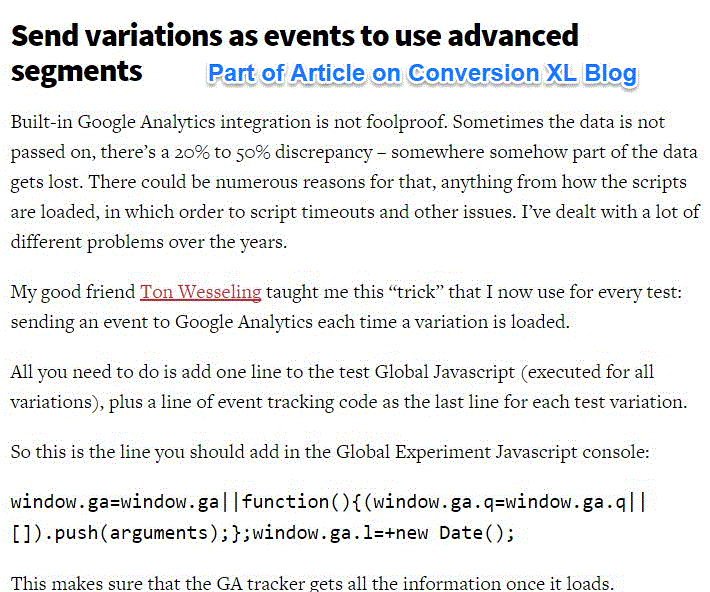 Now you can evaluate your A/B test campaigns not only on outcome metrics, but also on click behaviour.
This is incredibly useful if you want to learn more about your customers and their desires.
Note: on default you cannot distinguish between two links that lead to the same page/URL.
Grouping Pages
Tthe navigation summary report is built around pages.
However, some of you might be more interested in numbers that involve types of content instead of individual content.
Content groups are one of the 31 current settings in your Google Analytics account configuration.
These content groupings allow you to aggregate your content in separate groups.
A corporate website might include:
- Homepage
- Blog post
- Category posts
- Services
- About page
- Contact
- Client environment
This list might be longer for you; it all depends on the website that is involved.
Read this post if you want to learn all about content grouping in Google Analytics.
Interpreting the Numbers
Let’s have another close look at my good old marathon site:
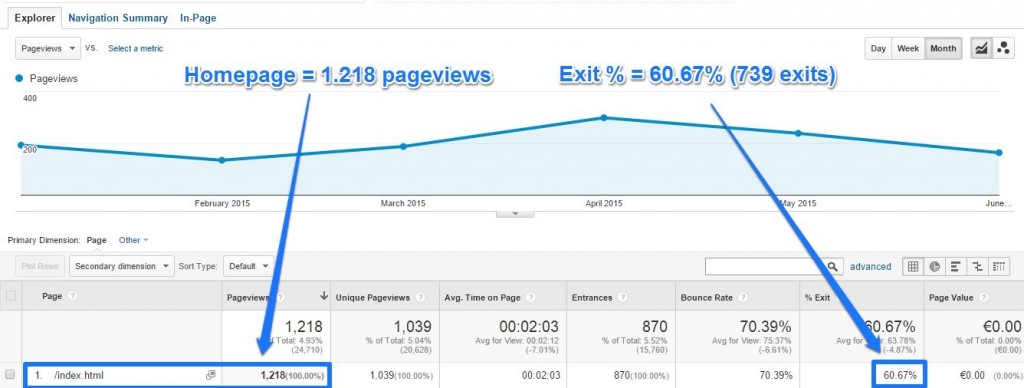
- 1.218 homepage pageviews
- 739 exits
- 479 next page pageviews
Next step is to take a look at the previous and next page path summary.
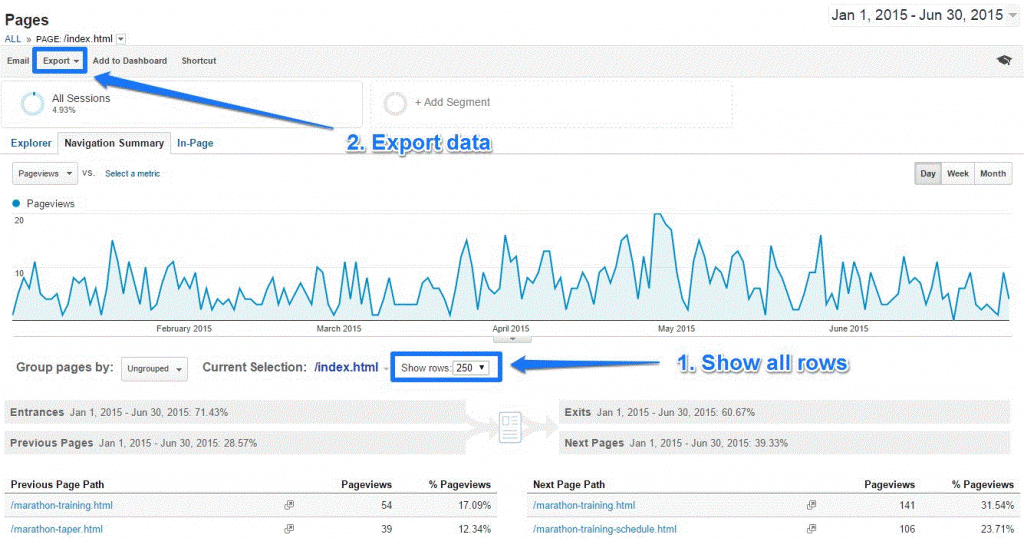
The exported data looks like:
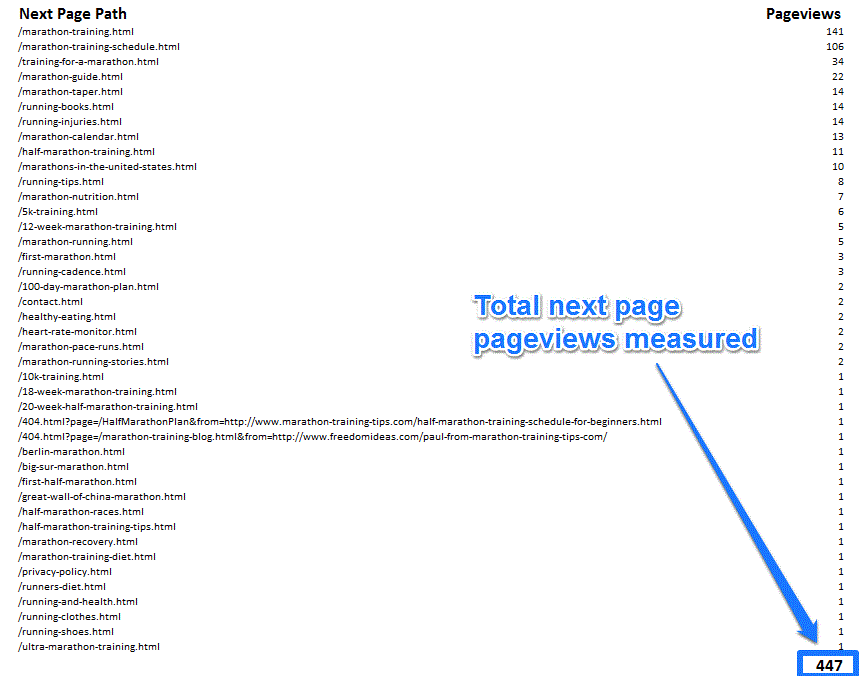 You will notice something awkward if you look closely at the numbers.
Based on the earlier showed report we expected 479 pageviews, but instead we see 447.
Where does this difference of 32 (479 – 447) come from?
I have built a custom report – get the next page path report here – to show the actual cause.
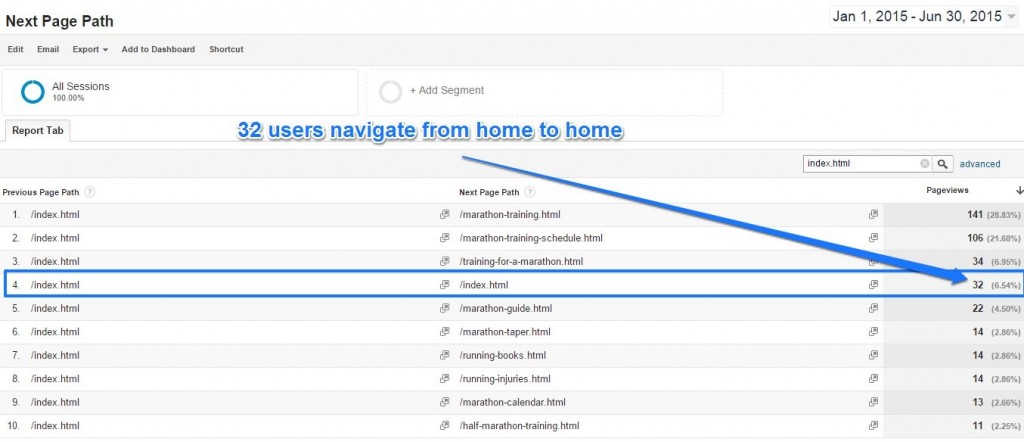
If someone – for whatever reason – navigates to the same page, this is not taken into account in the numbers of the navigation summary report. Keep that in mind when interpreting the numbers.
Please note that the “next page path” dimension is deprecated and might not be there anymore in the (near) future.
Exporting More Than 500 Rows
On default, you can export 500 rows from the navigation summary report.
There are different solutions if you need to export more rows of data.
1. Google Analytics API – Free Solution
You could get all the relevant data by using the Google Analytics API (combined with Google Sheets).
Automating your Google Analytics data export is really useful and can be used here as well.
2. Supermetrics – Paid Solution
Supermetrics is one of tools in my recommended tools list. It works excellent together with the Google Analytics API.
It can be useful to extract this data so make sure to at least install the Google Analytics connector via Google Sheets.
This is it for now, hope you have learned something new!
Do you already use the navigation summary report and in what ways was it useful for you?
One last thing... Make sure to get my automated Google Analytics 4 Audit Tool. It contains 30 key health checks on the GA4 Setup.
Are you limited still by report sampling when exporting greater than 500 rows for larger properties? How do you get around that?
Hi Richard, data sampling can always occur if you export larger data sets.
Two things to keep in mind here:
– Use filters over segments in the API to keep sampling to a minimum. Segments are really a pain for sampling
– Automate your data export on a weekly or even daily basis to further limit the effect of sampling
If you haven’t read it yet, check out one of my latest articles about sampling:
https://online-metrics.com/eight-smart-ways-to-deal-with-google-analytics-sampling/
Best,
Paul
Hi Paul,
Given that filters are for going forward data only and is really meant for a separate property or sub section of a property; it is a bad use case to get around this issue (and you will still have sampling issues with a filtered view. (You can’t make a single filtered view for each dimension – that would be an admin nightmare).
Even automating on a regular an export isn’t without errors as sampling gets into that causes problems. But these problems are worse because you aren’t expecting sampling.
Thanks – checked your link out. Although the work-arounds/hacks to get around sampling still don’t solve the problem. Google analytics is not an optimal tool for this use case.
Thanks for your comment Richard.
With regards to filters I didn’t mean view filters, but the filter option in Google Analytics API:
https://developers.google.com/analytics/devguides/reporting/core/v3/reference#filters. Not sure whether it would work for you, but you can give it a try!
It really depends on your actual data needs and website traffic whether data export automation could work or not. For very large websites you could still get into problems indeed.
Good luck with finding a solution here!
Hi Paul, thanks for the thoughtful response.
In regards to API filters – they still have the same sampling issue that segments do (according to the documentation)
Hi Paul,
Thanks for the article, it was great.
I liked how you linked GA to AB testing. It showed how all those data can come in handy. It was also great to link it to an article about event tracking (the best!)
Cheers,
Thanks for your comment Fanny. I am glad you enjoyed the read!