Getting the default Enhanced Ecommerce implementation working is great, but can you fully optimize on revenue and conversion rate metrics? I have discovered a smart way to enhance your revenue metrics with the gross profit metric.
Would you prefer more revenue and a lower profit margin or does less revenue and a higher profit margin sounds better?
In general these factors contribute to a more healthy business:
- A higher profit margin per product.
- A higher quantity of products sold with good profit margins.
- More repeat purchases.
- Less churn on your customer base.

In this post I will explain the concept of calculating gross profit metrics in Google Analytics in all depth.
Although it might sound daunting at first, it’s not that difficult to implement.
Table of Contents
- Gross Profit vs Revenue
- Add Custom Metric
- Import COGS Data
- Advantages of Data Import
- Test Custom Metric
- Calculate Gross Profit
- Build a Custom Report
- Optimize Ecommerce Performance
Gross Profit vs Revenue
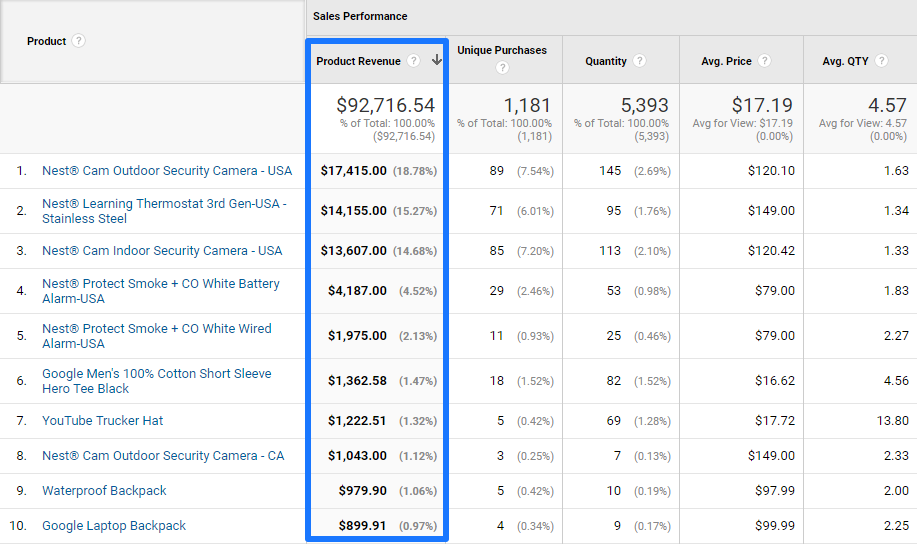
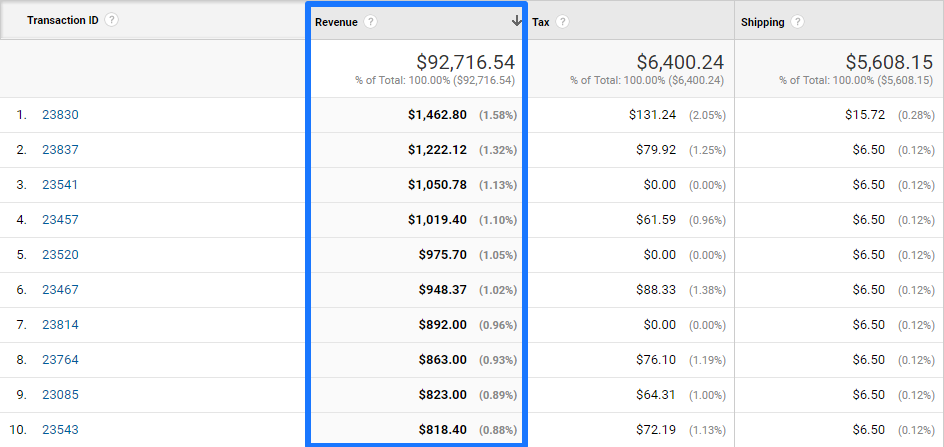
By default – and after implementing (enhanced) ecommerce – Google Analytics equips you with different revenue metrics.
Product Revenue
Transaction Revenue
 Here is a quick example on the importance of gross profit data.
An online retailer is selling televisions. The average profit margin on a TV ranges from 10 to 20%.

- Profit margin is 10%.
- Discount special promotion is 5%.
- Sales is increased from 20 TV’s to 40 TV’s.
- Gross profit is decreased with $400.
You would have evaluated this campaign in an entirely different way if you would only look at revenue numbers.
I hope by now you understand the Cost of Goods Sold (COGS) metric is very important to take into calculation as well.
Here are two product profitability calculations to keep in mind:
- Gross Profit = Revenue – Cost of Goods Sold
- Gross Margin (%) = (Revenue – Cost of Goods Sold) / Revenue * 100%
Add Custom Metric
The first phase in working towards getting profit data in Google Analytics, is by setting up a custom metric in Google Analytics.
There are three types of metrics in Google Analytics:
- Default Metric: available in all Google Analytics accounts.
- Custom Metric: 20 (200 in GA 360) available in each Google Analytics property.
- Calculated Metric: 5 (50 in GA 360) available in each Google Analytics view.
Please note that you can’t apply custom metrics to historical data.
On the other hand, calculated metrics can be applied to all data including historical data. This is really powerful!
The Gross Profit product metric is our final goal, but first we need to set up a Cost of Goods custom metric.
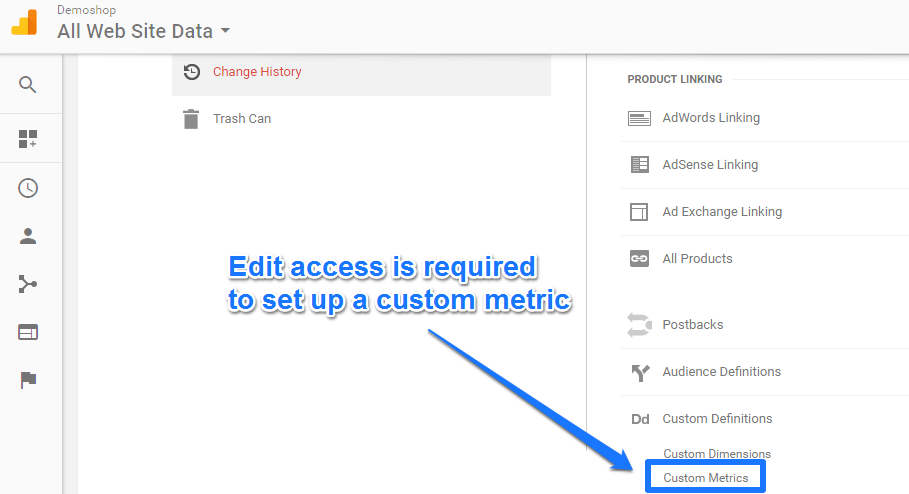
Step 1: navigate to admin interface.
Step 2: create a custom metric.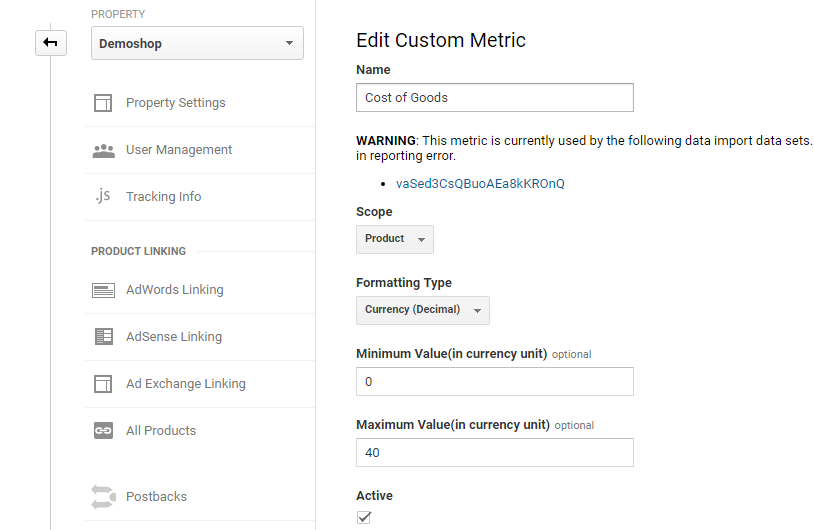
- Name: Cost of Goods.
- Scope: Product, in other cases you might want to choose “Hit” level scope.
- Formatting: Currency is the right choice.
- Minimum Value: 0, as Cost of Goods can’t be negative.
- Maximum Value: 40 in this case; I recommend to set this value to prevent the negative effects from mistakes with comma’s or dots.
And you’re done with this step!

Import COGS Data
You have multiple options in getting Custom Metric data in Google Analytics.
Here are two ways to deal with this:
- Use the Data Import functionality to (automatically) import certain data.
- Implement the custom metric hardcoded or via GTM on your site.
The second method can be great, but only if you pass non-sensitive data into Google Analytics.
In this case I want to be careful as I don’t want the competition to become suspicious after debugging my Analytics implementation. :-)
That’s why I choose for the savest way and use the data import functionality.
Step 1: set up your data set schema.
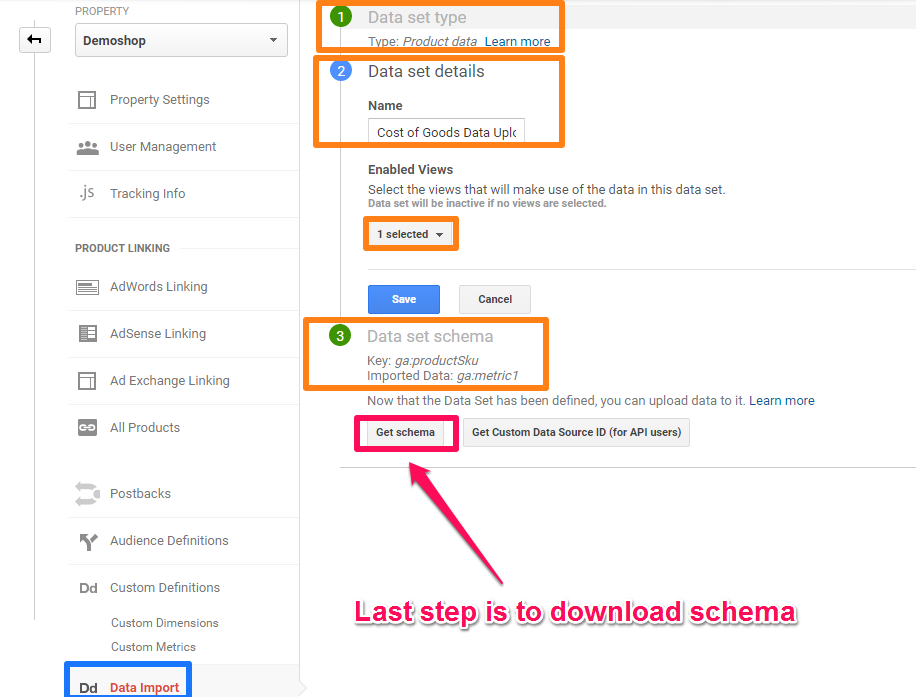
Step 2: download schema.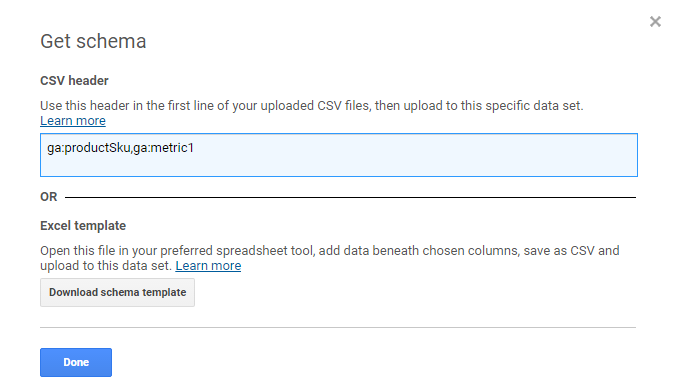 Here you can read more about specific rules for your data import.
- ga:productSku = product SKU.
- ga:metric1 = custom metric #1 (in our case: Cost of Goods).
Instead of manually uploading this data, you could opt for an automated way. This is especially useful if you are dealing with thousands of products and a lot of changes in your assortment. If that’s the case, you need to use the API functionality to automatically upload the data.
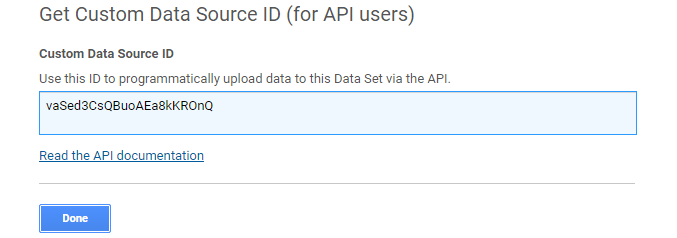 There are a ton of tools out there that can help you automate this process.
Step 3: manually upload your data scheme.
I have filled in just one SKU and the Cost of Goods value for demonstration purposes:

And as you can see, Google Analytics has accepted my data import:
 Please note that it might take up to 24 hours before your custom metric data becomes available in Google Analytics.
Advantages of Data Import
By now you understand how the process works and why you should use the data import functionality to import the COGS metric in Google Analytics.
Analytics has two main ways of gathering data:
- By sending hits collected by the JavaScript tracking code or (mobile SDK or Measurement protocol).
- By using Data Import functionality.
There are a few reasons why you would want to refrain from the default data collection method (option 1):
- Augmenting hit data requires extra time and a knowledgeable developer to write custom code.
- The data is sensitive, so you don’t want to send it in clear text.
- The amount of data is large, so you don’t want to append it to each hit.
- The data is not available when the hit occurs.
Test Custom Metric
You have set up your Custom Metric in Google Analytics, but there are still a few steps to take.
There are two important things to note:
- Custom metrics are not directly visible in your default reports.
- You (and your competitors) cannot debug the metric as we have used the data import function to convey the data.
It means you can do a test transaction and wait for some time to see whether your custom metric data is coming in.
Here is my recommendation:
- Start with a manual upload of one SKU and the custom metric value.
- If it works, you can either decide to add a list covering all of the SKU’s or start experimenting with automating this process.
Keep in mind that data import automation should only be applied after you know that it all works propertly.
A simple trick to review your Custom Metric:
Step 1: navigate to “Product Performance” report.
Step 2: click on “Customize” report.
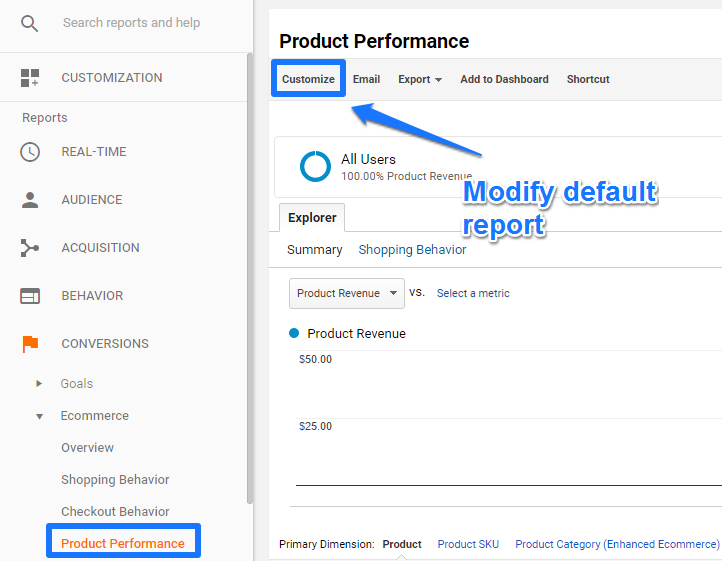
Step 3: Include “Cost of Goods” in custom report.
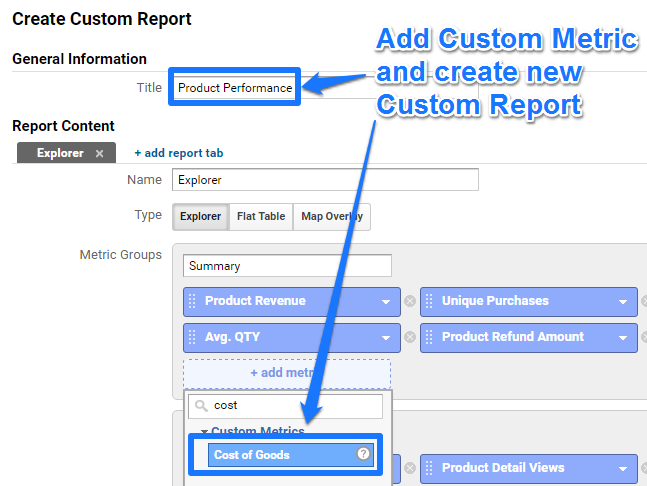 Save the report once you are satisfied with the custom report setup.
This allows you to quickly review the Custom Metric “Cost of Goods”.
Inflated Numbers
Great feedback from Analytics Expert Zorin Radovančević and the Analytics Ninja:
“I remember having issues when widening on a metric such as COGS in your case – will it not inflate the metric on each hit where product sku is present and not only for the purchase action?”
And this is true, it definitely can cause issues where the COGS is inflated in your reports.
Solution
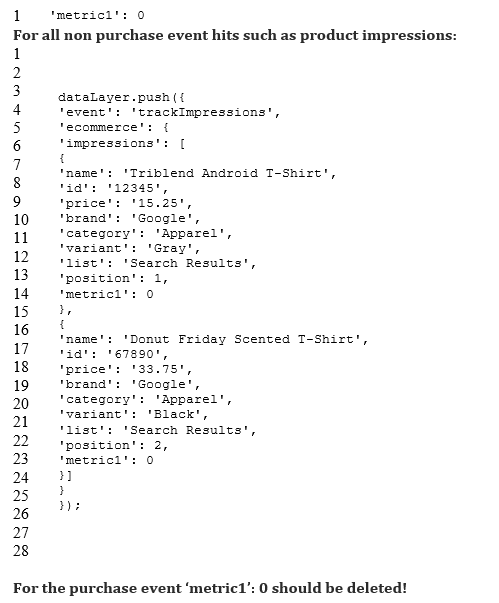
It requires you to set the custom metric (metric1 in this case) to zero within each Enhanced Ecommerce payload for all products expect the one on the purchase action. And you would want to implement this via the dataLayer.
Calculate Gross Profit
There is one more important step to take: setting up a calculated metric!
You want to judge your product performance based on gross profit instead of product revenue.
Characteristics of ecommerce products:
- Products often vary in price due to promotions / changes by competitors.
- Cost of Goods (of one individual product) tend to be rather stable of time.
This is why you don’t want to directly upload a “gross profit” metric in Google Analytics.
Instead you can calculate the metric which takes into account fluctuations in price and product revenue.
The setup is rather easy:
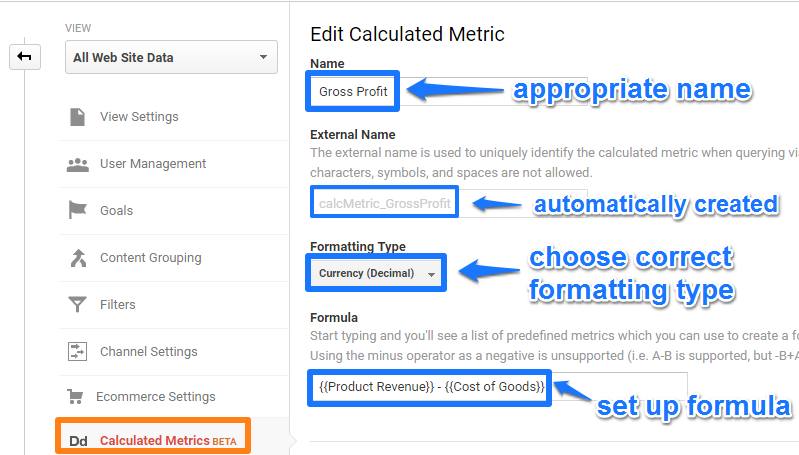
In the Formula you don’t have to type in the curly brackets by yourself.
Just search on “Product Revenue” and “Cost of Goods” (name Custom Metric) and Google will do the rest.
The beauty of Calculated Metrics is that they work retroactively! It means that you can apply the Calculated Metric to historically collected data in Custom and Default Metrics.
Build a Custom Report
I have already shown how to build a custom report with the “Cost of Goods” metric.
Now the “Gross Profit” metric is also available, you should slightly modify your earlier created report.
Here is a direct link to a Custom Report that incorporates both metrics. Make sure to save it in the appropriate views and you are good to go.
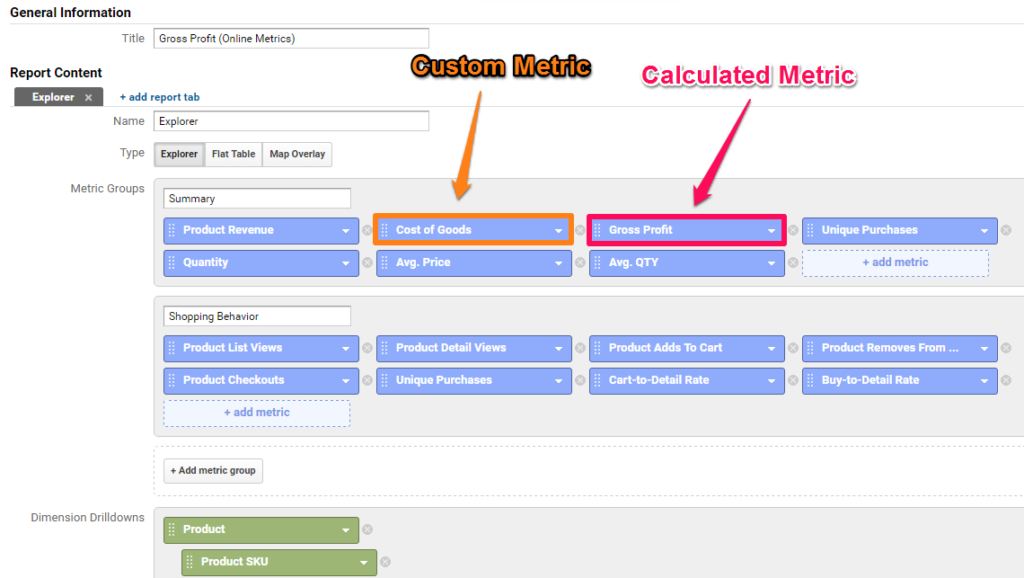 Feel free to adapt it to your needs!
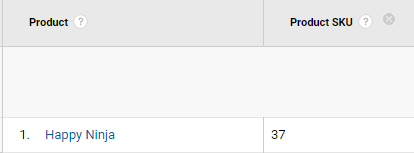
A snapshot of the main metrics in this report:

And as you might expect, ga:productName matches with ga:productSku from the earlier defined data import.
Optimize Ecommerce Performance
Of course, the goal of getting this data into Google Analytics, is not just reporting.
You want to analyze it and optimize your ecommerce performance accordingly.
A few examples of questions to answer:
- What’s the effect on Gross Profit in heavy promotion periods?
- Which product delivers the highest Gross Profit?
- Which products are actually costing us money?
- What is my overall gross profit margin?
- What is my gross profit margin per category?
- How can we increase our gross profit margin?
- Which channels drive the highest gross profit margin?
- What would be the effect on overall gross profit margin if we make our assortment smaller?
Note: configure an additional Calculated Metric to calculate the gross profit margin percentage (!)
Subtract the costs of goods sold from the total revenue. For example, if the company has $300,000 in revenue and $240,000 in costs of goods sold, you would subtract $240,000 from $300,000 to get $60,000. Divide the result from Step 2 by the revenue to calculate the gross margin.
Well, this is it from my side. Hope you enjoyed reading the post!
Do you have any additional thoughts? Make sure to share it with your audience if you think it is valuable for them as well.
One last thing... Make sure to get my automated Google Analytics 4 Audit Tool. It contains 30 key health checks on the GA4 Setup.
Another great post Paul. Thank you for writing this. One question: Can this be applied to a Saas business? For example, when customers convert from a free account to a paid subscription, they are billed monthly. At the time of conversion, the credit card is not charged. The actual charge, or payment transaction, occurs a month later. The process is automated, meaning that the card is charged by the payment gateway on a certain date (usually a month from the date the person signs up for a subscription). Customers can also choose to be billed quarterly, twice a year or annually. Just wondering if the process you described for e-commerce might be applied to this payment structure a Saas business may have. Thanks again for the great article.
Thank you for your comment and a great question Andrew. I personally think Google Analytics is not the best tool to accomplish this. And I haven’t implemented something like this in the past. You probably want to rely on external systems in this case.
Here is a good, short read on this topic: https://www.quora.com/What-is-the-best-way-to-use-Google-Analytics-to-track-sales-on-the-ecommerce-site-that-uses-subscription-business-model
Hi Paul, really inspiring. During a promotion Google analytics shows was price in the report not discounted price (promotional price). How do you suggest to show the real item price, in case there is a discount, on GA?
Hi Chiara,
Thank you for your comment.
You could use a custom metric as well. In each GA account there are at least 20 custom metrics available.
Best,
Paul
Hi Paul,
Great article. Regarding other non purchase ecom hits inflating the product margin metrics – couldn’t you just do a segment that includes all the purchase hits and exclude everything else? Instead of having to add 0 to every hit in the ecom datalayer that is not a purchase.
Hi Martin,
In some cases it might generate the data you need, but keep in mind that your unsegmented data will remain flawed. So in my opinion, you want to solve it before the Analytics data is processed and not just trying to fix it with segments.
Best,
Paul
Hi Paul!
Thank you for this good website, very appreciate your content.
Can you help me with these settings in GA? I have done all settings which you wrote in this article and did it step by step, but I found some bad data in GA and don’t understand why.
I uploaded cost data via “data import” in GA and upload costs of products, for example, 6 euro. but some of my cost of goods $6 and some $756 and I don’t understand why. I added you one screenshot to understand my question.
https://prnt.sc/gy65bu
Columns – PRODUCT SKU, PRODUCT REVENUE, COSTS OF GOODS and GROSS PROFIT
Can you help me with it?
Thanks!
Hi Ihar,
Thank you for your comment. That value seems strange indeed. It’s hard to advice from the “outside”, but what I recommend is using a debugging tool on your end to see what values are passed into GA and when. This will help to find out what needs to be fixed. It should work if everything is implemented correctly.
Best,
Paul
Hello, great post Paul and thanks for sharing it! I have followed the Data Import method to try and see Cost Of Goods data in Analytics, however having done this, I am yet to see any COG data, it’s been about 48 hours.. My 2 questions are, does the data import method have a time lag associated with it? And secondly, as well as uploading the COG for each SKU, do I need to edit the Universal Analytics tag to include this metric information? Thanks in advance for your help Paul and thanks again for your post!
Hi John, thanks for the heads up!
Question 1: it could take up to 24 hours approximately, but usually not longer than that. I recommend reviewing your setup.
Question 2: I recommend setting the COG metric to zero on non-purchasing event hits (via dataLayer.push method) once you see COG data coming through and the numbers look inflated.
Hope this helps!
Paul
Thanks so much for your guide, I have set everything up according to your guide. Hopefully it works for me too. :D
How long does it usually take for custom metrics to start populating data?
You’re welcome Peter, hope it works. Usually, you should see the data coming in within 24 hours.
Update: It works perfectly for me. :D.
Quick question, is it possible to add monthly expenses?
Long story short, I have been buying banner ads from various websites that want to be paid monthly. Is it possible to add those in?
Great and yes you can. But usually you want to use the “cost data import” functionality in that case. Haven’t written an article about this myself, but you can check this one: https://www.lovesdata.com/blog/cost-data-import.
Hi Paul,
Thanks so much for your help. I encountered another issue when users buy 1 product in bulk at 1 single checkout.
The custom metric of “Cost of Good” multiply by “Unique Purchases” instead of “Quantity”, hence incorrect data of total “cost of goods” per checkout. You can check my stats here: https://gyazo.com/23a515c7f7db0dca9dfcdeff0f704174
The total “cost of goods” should be $231 instead of $77 since the quantiy is 3, not 1.
Is there some setting I am missing?
Thanks so much
Hi Peter,
Unfortunately, I am not sure why this is happening if you have followed all outlined steps.
Not the most elegant solution, but I think you could set up a different “calculated metric” to get the exact numbers that you need.
I am thinking of: ({{Product Revenue – ({{Cost of Goods * {{Quantity}})) = Gross Profit. I recommend giving this a try if you can’t get accurate numbers in GA on the regular method.
Otherwise you have to go for a different technical solution which I can’t technically assist with.
Best,
Paul
Hello, I’m confused about implementing the datalayer solution to fix inflated COGS. How is this implemented?
Hi Brad,
What is exactly causing confusion? You need to set the custom metric to zero in the dataLayer for all payloads except the one on the purchase action. Most probably you need to talk to dev department to get this implemented.
Best,
Paul
Hi Paul,
I spoke to a dev and it looks like this isn’t possible to do on a Shopify store. Is there another fix?
Thanks,
Brad
Hi Brad,
Sorry to hear that – this is the only approach I am familiar with and have tested.
You might want to ask it at a specific GA forum, someone else might be able to help.
Best,
Paul
Does your solution for inflated metrics still work?
When I send the zero value to GA it’s still using the Data Import value.
Yes, I believe it should still work.
Hi,
I have the same impression. Did you find a solution for this?
My product costs appear to be exceeding my revenues because they seem to be added too much and not only on purchases :/
Once again great post, Paul. Thank you for taking the time to write it. One question though, does this only work when you have Enhanced Ecommerce enabled? I have everything set up but the Cost of Goods and Gross Profit numbers are incorrect. The Cost of Goods custom metric is reporting zero and the Gross Profit matches the product revenue. I assume this is caused by the Cost of Goods being zero, but I can’t figure out why.
I’ve uploaded the data and also waited 24 hours.
Hi Mike,
Thanks for your comment. Product scoped custom metrics only work within an Enhanced Ecommerce setup. So I recommend looking into an EE implementation.
Best,
Paul
Have tried 4 different GA companies to try and get this working successfully and still no luck. Don’t know who to ask next. Any recommendations? Everyone I spoke to and shared this article with said “Yes, shouldn’t be a problem”. Each one failed and eventually gave up without being able to articulate what the problem actually was.
Hi Robin,
Not sure what’s going on there, but as one good thing to do is to leave a note here:
https://support.google.com/analytics/community?hl=en
There might be someone out there who can further support (in a different way) with solving the issue.
Best,
Paul
Hi Paul,
Thanks for the perfect article, I would like to ask you for advice. We sell personalized T-shirts, this means that calculating product costs is much more complicated, because it consists of BASE TSHIRT COSTS + PRINT COSTS ( there can be multiple prints, and also each print may cost different sum ), so we decided to calculate COGS for each TRANSACTION on the server-side, and we want to import it via custom metrics to Analytics ( as a part of transaction data ) , is there any way how to import it, but not on PRODUCT level ?
Any idea how would you recommend us to do it? Thanks a lot for your advice, Peter
Hi Peter,
Unfortunately, I have no experience with such a setup. And actually, I believe you can’t get it to work in that way as custom metrics (for Enhanced Ecommerce) are set at the product-level, not transaction. This is how you configure it in GA.
Your best try would be to ask your question in a broader place: https://support.google.com/analytics/community?hl=en. Let me know what you hear back!
Best,
Paul
Hi Paul, thanks a lot, I will try to post my question to the forum.
Cheers,
Peter
Hello,
I tried to make this work with 2 products but it always takes the cost of goods of the first product.
Any tips on the csv file? Do I use tab or comma?
Hi Martijn,
Please see:
https://support.google.com/analytics/answer/6014981?hl=en&ref_topic=6064618
The data files must be uploaded in CSV (comma separated values) format.
Best,
Paul