Google Analytics comes with many built-in features to segment your data. In this post you will learn all about the often overlooked feature table filters and how and when to use them.
Note: some of the links on this page are affiliate links. Link to affiliate disclosure.
Most reports in Google Analytics are displayed in table form. As we both know, segmentation is the key to derive insights from your data.
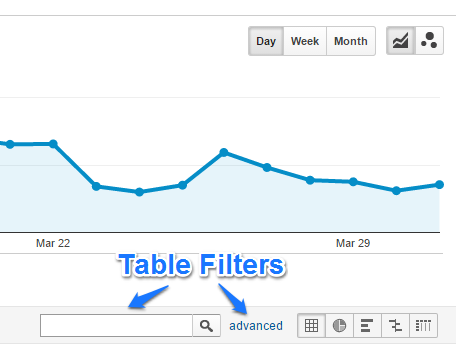
Table filters help you to slice and dice through the data in your reports in a quick and easy way.
Table of Contents
- Report Building Stones
- Admin Filters vs Table Filters
- Standard Table Filters
- Advanced Table Filters
- Secondary Dimensions
- Flat Tables
- Google Analytics API
- Concluding Thoughts
Report Building Stones
The first concept that is important to understand is that each report is connected to one or more metrics and dimensions.
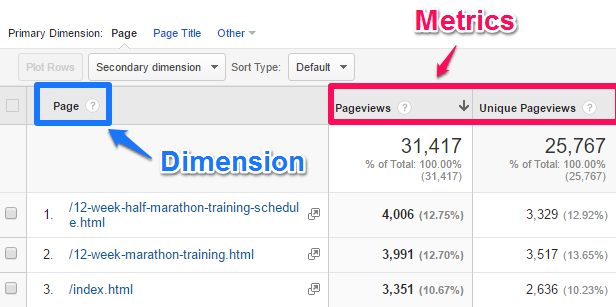
You can create reports with multiple dimensions or stick with the basic report and add a secondary dimension.
The same counts for metrics; each report has it’s own unique set of metrics. You can customize it to your needs, by setting up custom reports.
Admin Filters vs Table Filters
I already published different articles on using Google Analytics filters for segmenting data and finding insights. Read this monster filters guide if you want to learn all about them.
There are a few differences between admin and table/report filters that are important to understand.
1. Admin vs Reporting Section
Admin filters are set up and applied in the admin section of your Google Analytics account. Only people with “edit” rights can set them up.
On the other hand, table filters can be used by anybody with access to a specific Google Analytics view.
This is a good thing because admin filters can ruin your data where table filters can’t.
2. Account vs View Level
Although admin filters are applied on the view level, they are account level objects. If you modify an admin filter on the account level, if will be modified in all views where it is applied.
Table filters are simply applied at the view level and only affect the data set of your current reporting view.
3. Permanent vs Temporary Role
Admin filters are applied to create multiple data views for different purposes.
E.g. you might want to create different views:
- Raw (untouched) data view
- IP filtered data view
- Mobile data view
- Testing view
- Etc.
With these filters, it is a permanent decision to create multiple buckets of data (reporting views) in your Google Analytics account.
Table filters are useful for ad hoc analysis. The same is true for segments in Google Analytics. Both table filters and segments are a great start in better understanding behavioral differences within your target audience.
4. Before vs After Data is Stored
Admin filters are processed differently compared to table filters. They can help to include or exclude data and to modify the data collection process. So before the data is stored in Google Analytics, the filters do their job.
Table filters work differently. They modify your already processed data, but just for the time being. Once you remove a table filter, the data returns back to normal.
5. Direct vs Delayed
Admin filters require up to 24 hours before they are applied to your data. Table filters work immediately on the data in your report.
6. Dimensions vs Metrics
Admin filters can only be applied to certain dimensions, e.g. hostname or device category. Table filters are more flexible and can be applied to any metric or dimension available in the report.
Keep in mind: segments are applied at the session or user level; table and admin filters work on the hit level.
Standard Table Filters
Standard table filters are like the name already implies really basic filters.
It allows you to filter on your data on the primary dimension in your report.
For example, I want to filter on the “half marathon” website pages.

Now you can see all pages that contain “half-marathon” as part of the request URI.
But what if I only want to see the pages that start with “half-marathon”? This is when regular expressions are really useful.
You just type in “^/half-marathon” and there you go:

As expected the number of pages and pageviews returned is lower now.
This is an easy and quick way to get an overview of a subgroup of pages and how they perform.
I recommend to read this in-depth guide on content groupings if you want to analyze your content at a deeper level.
As you can see, the standard table filters are rather limited. You need to use the advanced feature to get the most out of them.
Advanced Table Filters
The advanced table filter feature let’s you filter on your report data on any metric and dimension that is available in your report.
To get the maximum out of this feature I recommend to create a few custom reports that are in line with your business objectives.
It will provide you with more meaningful insights if compared to the standard reports by itself.
For the sake of this example, I will use a standard report of my protein affiliate website (sidenote: I don’t use protein powder myself, it’s just an awesome market for affiliates :-)):
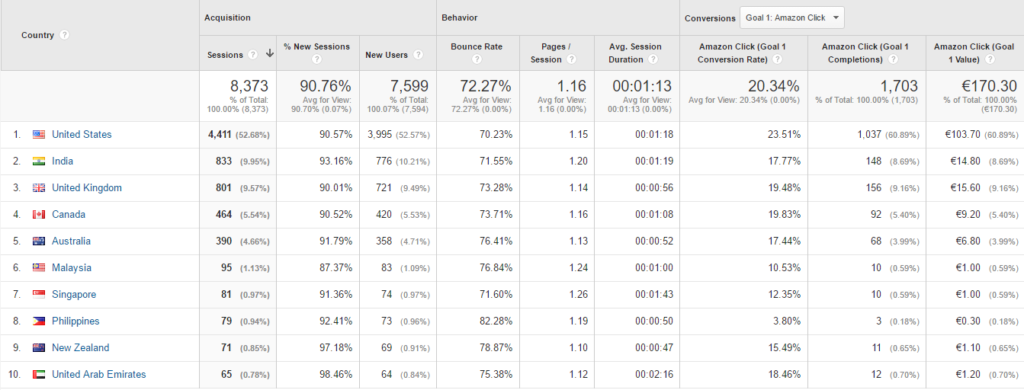 The main goal of this website is to inform people about protein powders that are available and send them to Amazon to buy their desired product.
This website converts like crazy with an Amazon CTR of 20% at the session level. Enough about that.
What if you want to slice and dice through the data at a deeper level? Use advanced table filters and here is how!
Step 1: click on advanced near search box.
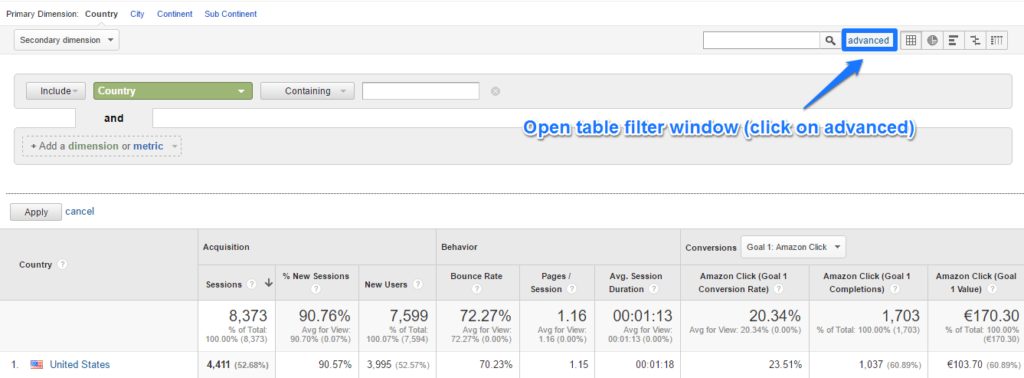
Step 2: add a combination of include and exclude filters to build your advanced filter.
Here are the rules:
- Choose from the dimensions and metrics available in your report
- Use an “AND” statement to filter on multiple dimensions and/or metrics
- Use a regular expression if you want to build an “OR” function
- Dimension: filter on begins with, ends with, exact match, RegEx or containing
- Metrics: equals, less than or greater than
The larger your data set, the more meaningful the usage of advanced table filters will become.
A quick example:
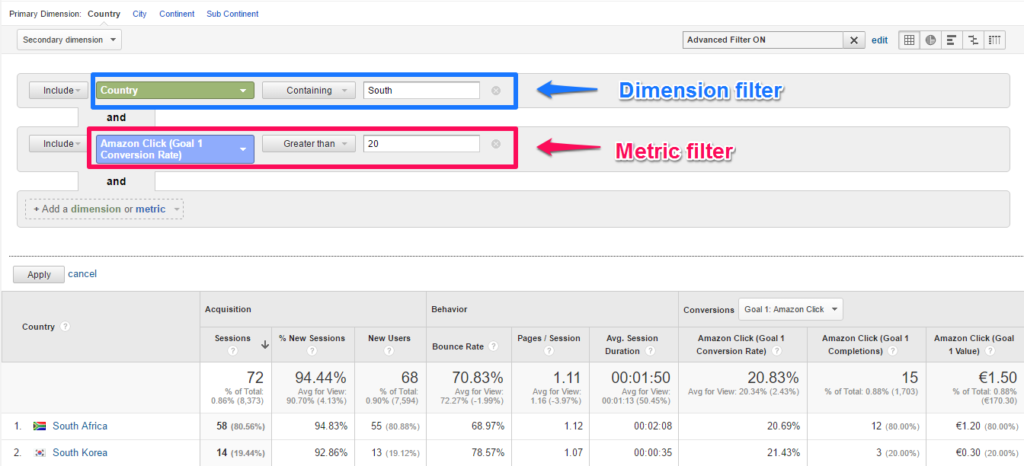
I have now matched the data with countries containing the word “South” that have an Amazon CTR higher than 20%. As you can see, just “20” is enough to make this to work.
Secondary Dimensions
You can smartly apply a secondary dimension so that your advanced filter works both on the primary and secondary dimension.
Here is how it looks like:
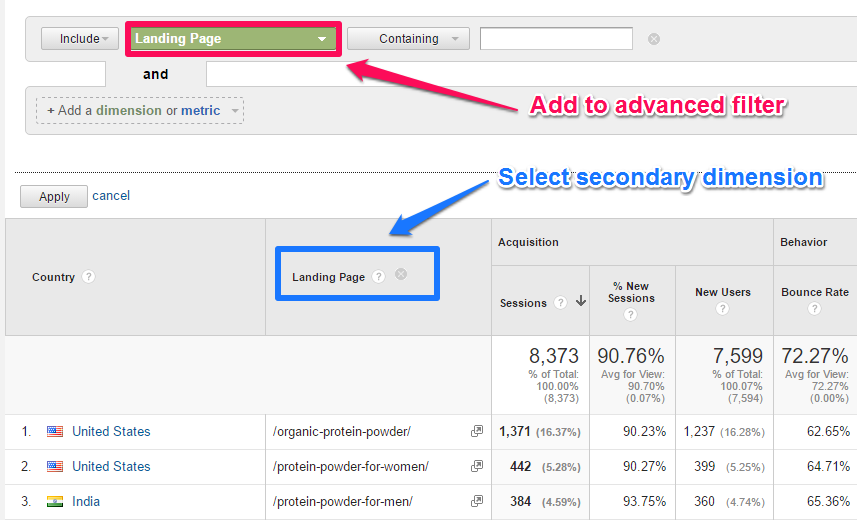
This gives you much more flexibility in drilling down into your data.
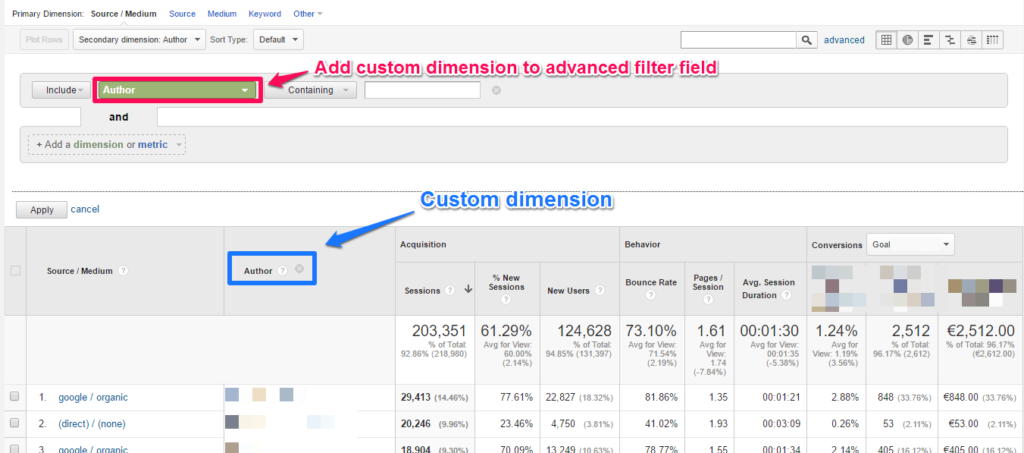
And this also works on custom dimensions and metrics in your Google Analytics account. Here is an example:
 Flat Tables
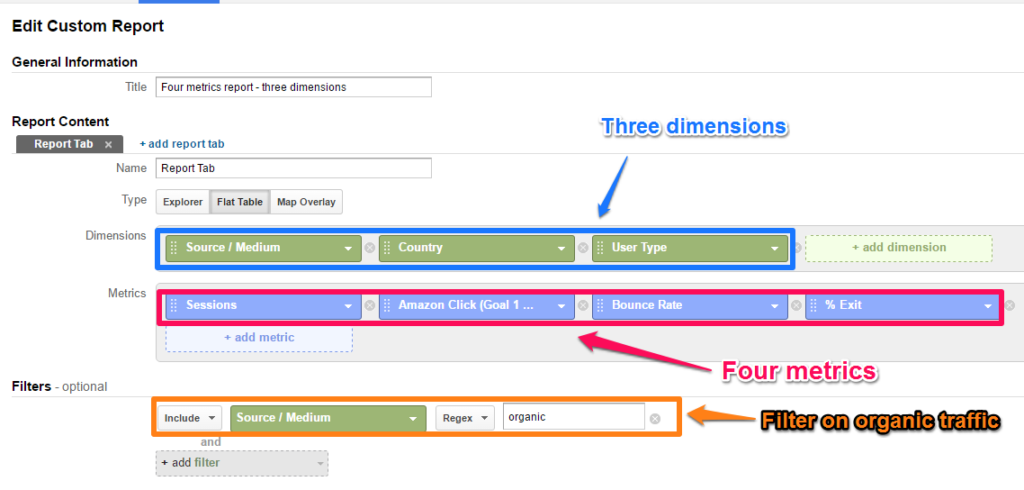
There is another option if you want to work with more than two dimensions.
In that case you could use a custom report designed as a flat table.
Here is an example:
And this is how the advanced filter section looks like:

As you can see, there are three dimensions available now.
In my opinion you should limit the number of dimensions in your Google Analytics reports.
It can easily become a mess if you work with too many different dimensions. If that’s the case, you could do your analysis in an external spreadsheet (with pivot tables).
Google Analytics API
Like I mentioned in the last chapter, after your initial data analysis, it’s better to continue your analysis in an external tool.
This is very helpful if you want to segment and analyze your data on a wide range of metrics and dimensions.
Here is a link to the Analytics Reporting API V4. It’s the most recent version of the Analytics API at the time of writing.
The Google Analytics API is a great help to:
- Build custom dashboards to display Google Analytics data.
- Automate complex reporting tasks to save time.
- Integrate your Google Analytics data with other business applications.
Here are three applications that I recommend to use:
- Free Google Analytics Sheets add-on (great to start with)
- Supermetrics app for Google Drive (beginners to advanced users)
- Klipfolio (intermediate to advanced users)
In a future post I will explain more about the Google Analytics API and how to leverage it for your business.
Concluding Thoughts
- Always keep in mind that segmentation is where the money is. Your website visitors are different (buyer legends) and want to be served in a unique way.
- Find the balance in how much time you spend in this area. It can eat up a lot of time, but yield great results as well.
- Learn the difference between admin filters, table filters and segments and when to apply each of them.
- Start every data analysis with a business question, what are you trying to solve? And take it from there.
- Start with one or maybe two advanced filters and expand if needed.
- Use the shortcuts function if you want to (temporarily) save your table filter settings.
- Table filters are a great place to start; think about using an external application if you want to do more advanced analysis. There are many tools available to suit your needs.
What is your opinion on Google Analytics table filters? Happy to hear your thoughts!
One last thing... Make sure to get my automated Google Analytics 4 Audit Tool. It contains 30 key health checks on the GA4 Setup.
Awesome post, Paul. Helps me understand how to do it!
Thanks,
Sue
Hi Sue,
I am happy to hear this post helps you out. Please let me know if you have any further questions.
Paul
Hello,
Is there a way to use the “or” functionality between two different dimensions in the advanced table filter? I’m familiar with using “|” to filter a single dimension, but unsure how to replicate that functionality with two dimensions.
Yes, that’s possible, but first you need to build a (custom) report that contains at least two different dimensions. Then it’s possible to set up filters on two different dimensions via the advanced table filter. Hope this helps!