Which channels drive the most conversions and how do different channels interact with each other? In this blogpost we will explore the GA4 conversion paths in great detail.
Currently, Google Analytics 4 provides you with a small reporting section dedicated to conversion paths. You can find it within the ‘Advertising’ section under Attribution.
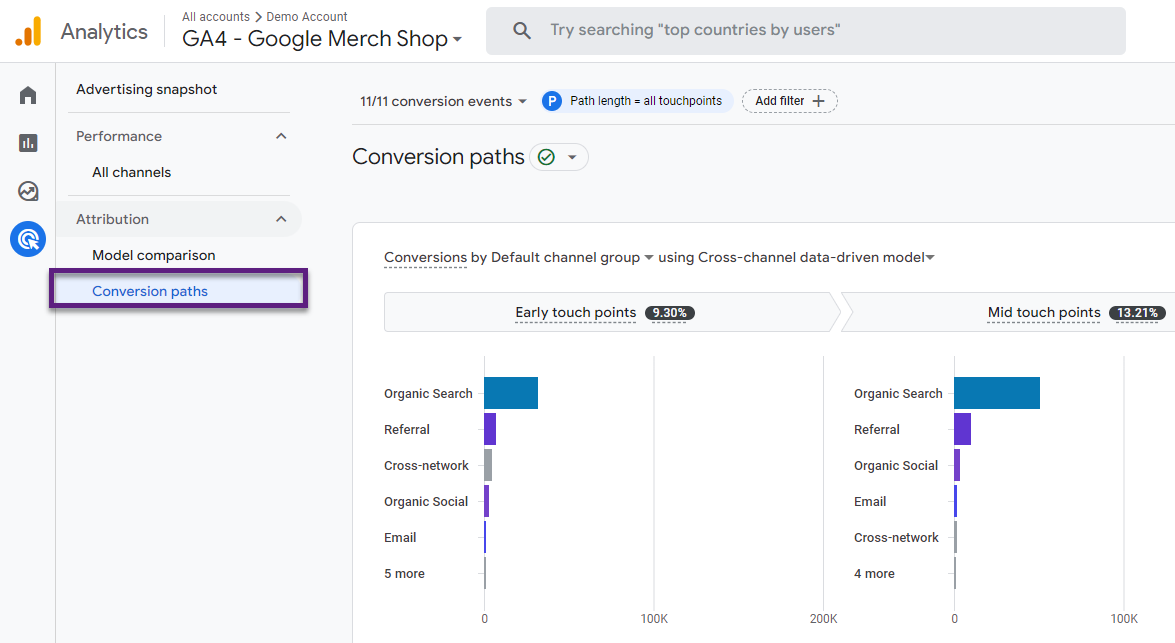
At the time of writing, this reporting section is less comprehensive compared to Universal Analytics and Attribution.
The fact that attribution is becoming increasingly difficult and the relatively small section in GA4, shouldn’t hold you back from getting the most out of it.
In this blogpost I will specifically talk about conversion paths in GA4 and how to leverage them in the best possible way.
“A conversion path is a guided journey a potential customer takes on your website to meet your goal. This path is different for all brands and aspirations but typically involves multiple touch points, pop-up reminders, email notifications, and other tactics to encourage an action.” by ClearVoice
Table of Contents
- Why is Attribution Increasingly Difficult
- Conversion Paths Report in GA4
- Available Conversion Models
- Report Prerequisites
- Touch Points Definitions
- Conversion Path Setup Options
- GA4 Conversion Path Insights
- Concluding Thoughts
We have lots to cover, let’s dive right in!
Why is Attribution Increasingly Difficult
The (non-direct) last click attribution model is there for centuries, but does it tell the complete story?
Potentially, two or more channels are involved and attribute to the same conversion.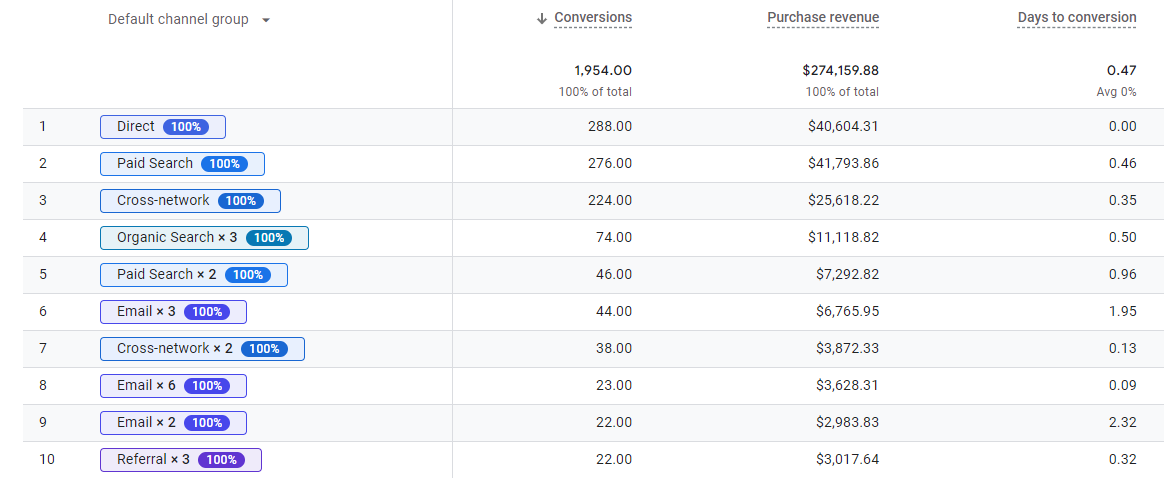 There are many more things that make attribution a real challenge.
A quick overview of related factors:
- Multiple browsers (often) lead to inaccurate attribution / user journey and conversion data.
- Multiple devices (often) lead to inaccurate attribution / user journey and conversion data.
- Cookie deletion skews user-level data and thus attribution path analysis.
- Data privacy challenges i.e. with iOS Apps lead to capturing incomplete/inaccurate data.
And this is just a short list, many more things play a role here and the list is increasingly growing.
Still, it makes a TON of sense to think about attribution if you want to learn about and act on user behavior and conversion paths.
The next chapters all focus on one specific report and how it can help you to understand a bit more about the user journey.
The limitations above (by far not a complete list) are no reason to skip the GA4 conversion paths report and the attribution section as a whole. Just know they have an impact on the data that you work with.
Conversion Paths Report in GA4
The Conversion Paths reports shows how conversions are attributed to different sources of traffic.
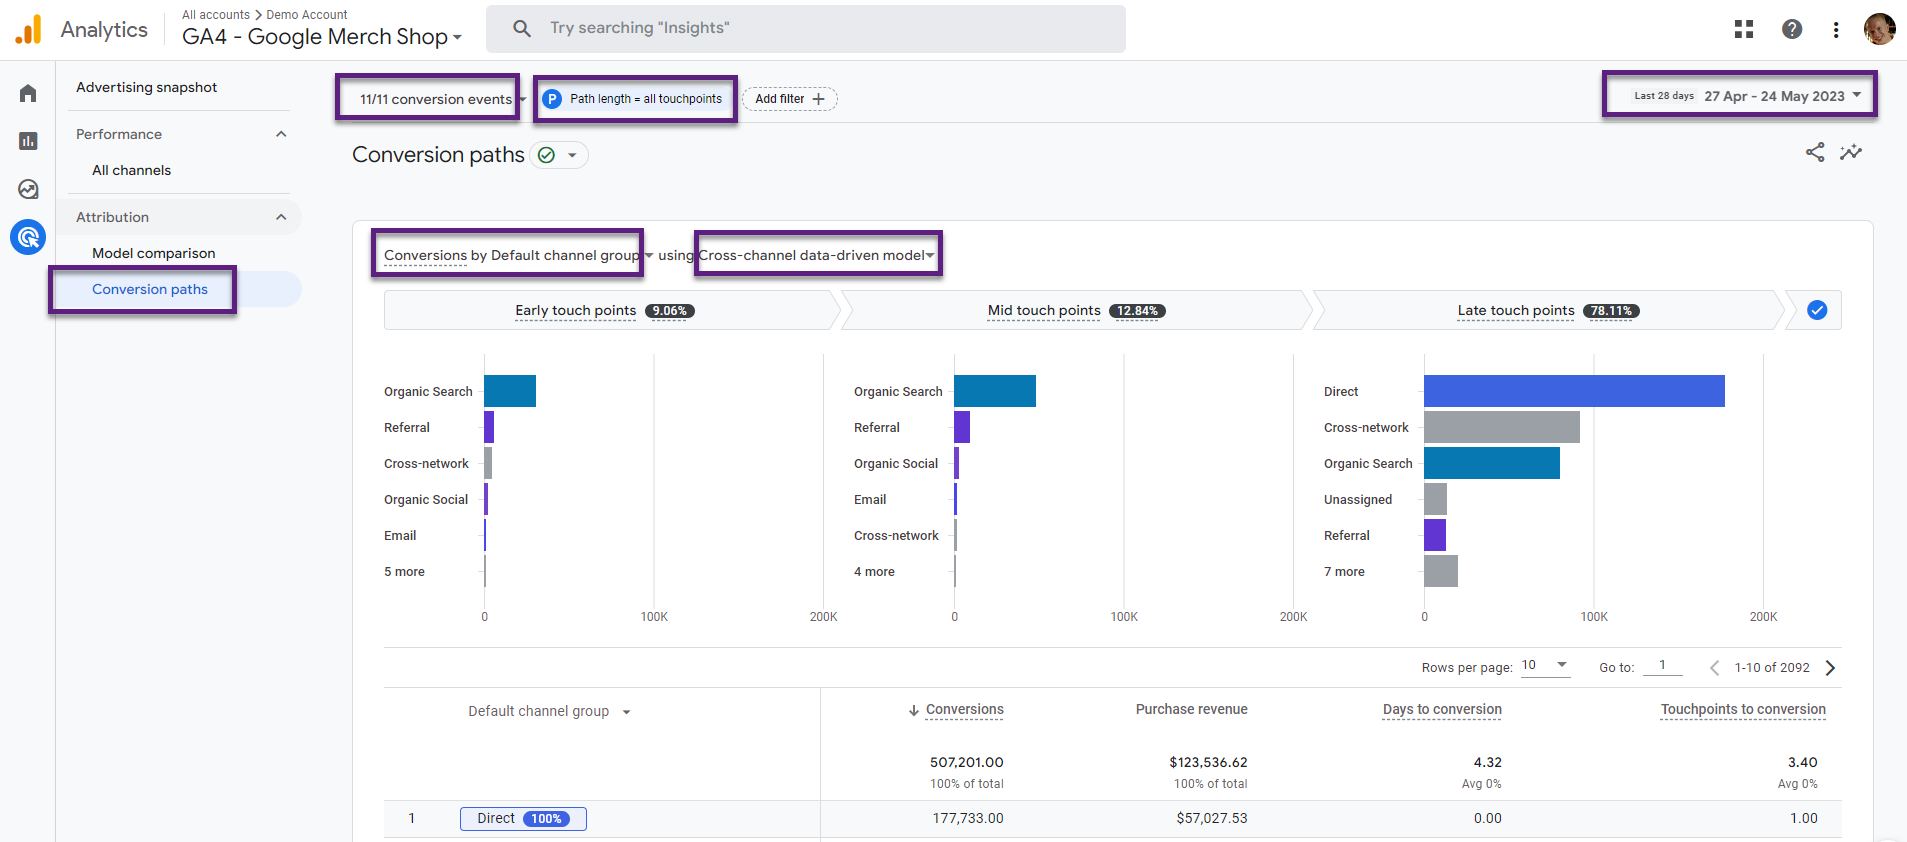
Available report components to play with that will impact the report outcome:
- Selected conversion event(s)
- Path length included, by default all touch points (max. 20)
- Date range, by default last 28 days
- Reporting dimension, by default Default channel group
- Attribution model, by default data-driven model
- *Optionally: you can include a filter to narrow the report data down to a subset of users
In addition, you can find out how conversion credit is attributed to one or more sources of traffic, example below.
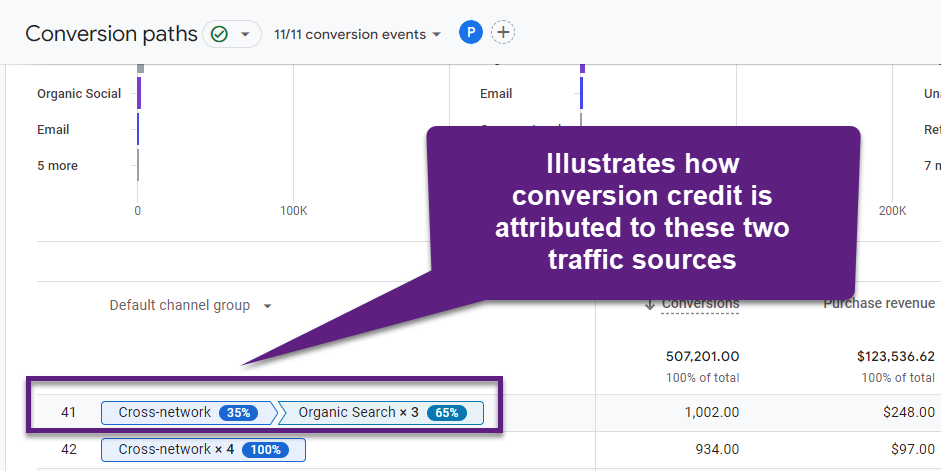
The example above (row 41) shows that 35% of all conversions / conversion credit (1,002.00) is attributed to one Cross-network touch point and the other 65% to the three Organic Search touch points.
Later in this article I will explain about how to set it up correctly so you can gain valuable insights.
In the Google Merchandise Store, there are many conversion events defined and you need to modify the settings to get meaningful data to work with.
Available Conversion Models
From September 2023, Cross-channel data-driven attribution, Cross-channel (non-direct) last click, and Ads preferred last click are the only available models in the Attribution reports of GA4.
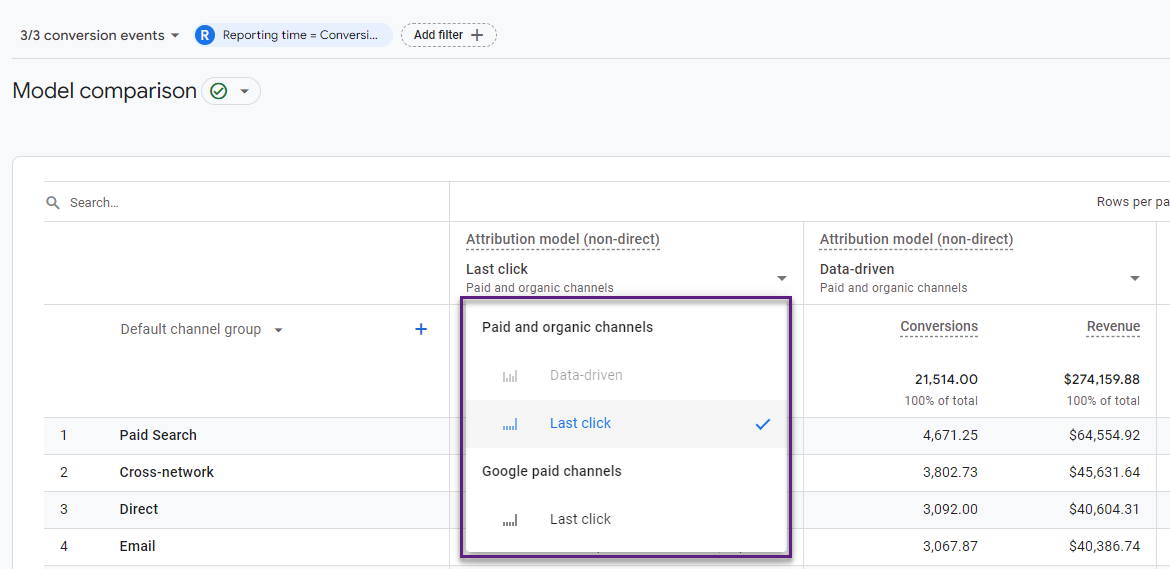
Additionally, there are ways to leverage BigQuery to build your own attribution models.
Report Prerequisites
The main prerequisite for using this report is to have data collected for one or more conversions.
This can either be Ecommerce transactions (via ‘purchase’ event) or non-Ecommerce events marked as conversions or both.
Three more things:
- I recommend to wait for at least 30 days (after conversions start tripling in) to have meaningful data to work with.
- In general, the more conversions on your website or app, the more meaningful this report becomes.
- Make sure to connect Google Ads to GA4 if applicable for your business. Not doing so will result in inaccurate data and attribution.
Touch Points Definitions
Google Analytics distinguishes three types of touch points in the conversion paths reports:
- Early touch points: First 25% of touch points in the path rounded to the nearest whole number.
- This segment is empty if the path has only one touch point.
- Mid touch points: The middle 50% of touch points in the path.
- If the path has < 3 touchpoints, this segment is empty.
- Late touch points: The last 25% of touch points in the path, rounded up to the nearest whole number.
- If the path consists of just one touch point, this segment has the touch point.
Here is an example when I only select the ‘purchase’ conversion.
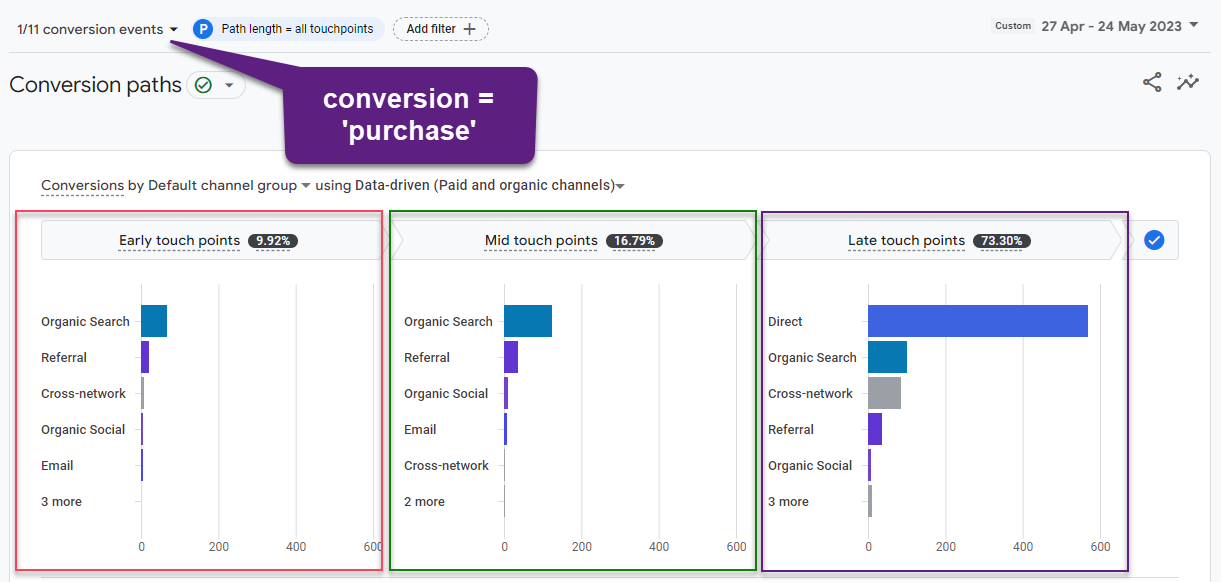
You can hover over each of the visible channels to get more details on conversion credits.
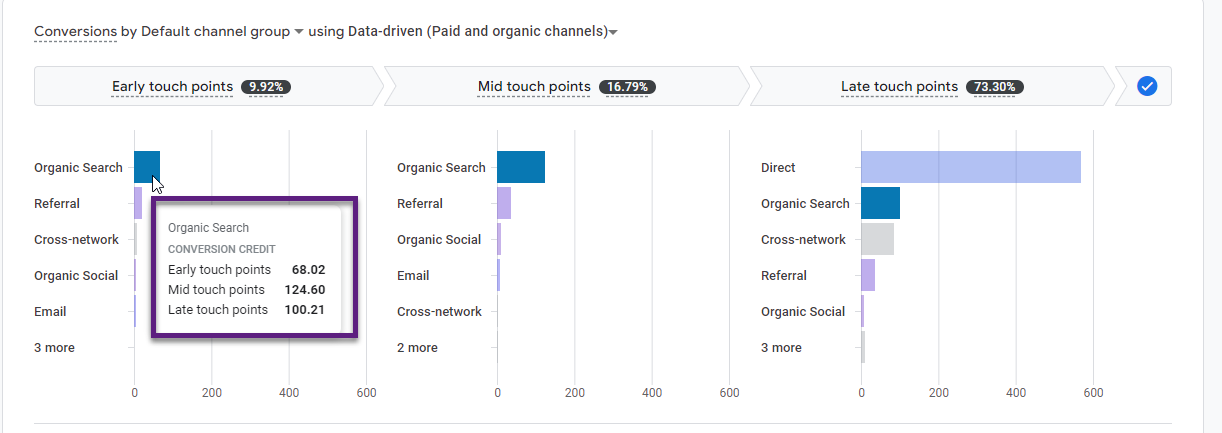
In terms of conversion attribution, Organic Search has a stronger impact in the middle of the conversion journey and towards the end. It doesn’t seem to initiate the conversion.
Of course, you would need to dig deeper to find out whether there are differences between branded and non-branded Search as that potentially has an impact as well.
If you hover over Cross-network, you can see:
- Early touch points: 7.58
- Mid touch points: 3.59
- Late touch points: 84.22
You can conclude here that the Cross-network channel is primarily closing the sale, but doesn’t have a (strong) contribution at the top of the funnel (seeding awareness).
The analysis is made based on the Data-Driven attribution model.
Keep in mind:
- The early touch points and mid touch points remain empty if you select Cross-channel (non-direct) last click as the attribution model.
- The early touch points and mid touch points show a very small number of data/channels (negligible) if you select Ads preferred last click as the attribution model.
Conversion Path Setup Options
You have different options when setting up the conversion path report for maximum insights. I will discuss all the features below.
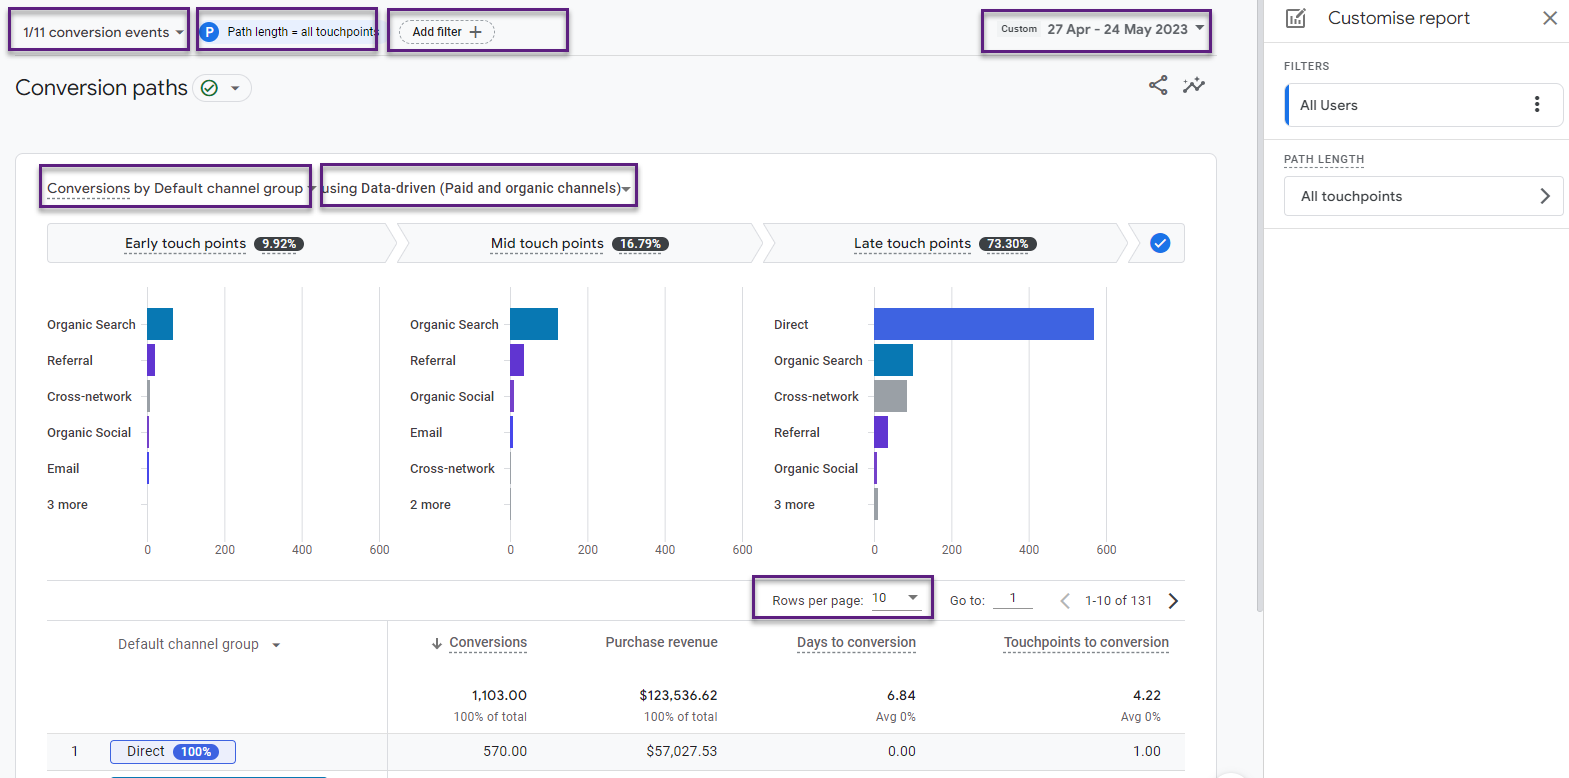 1. Date Range
You are flexible to select the required date range similar to other reports.
Keyboard shortcuts might come in handy here.
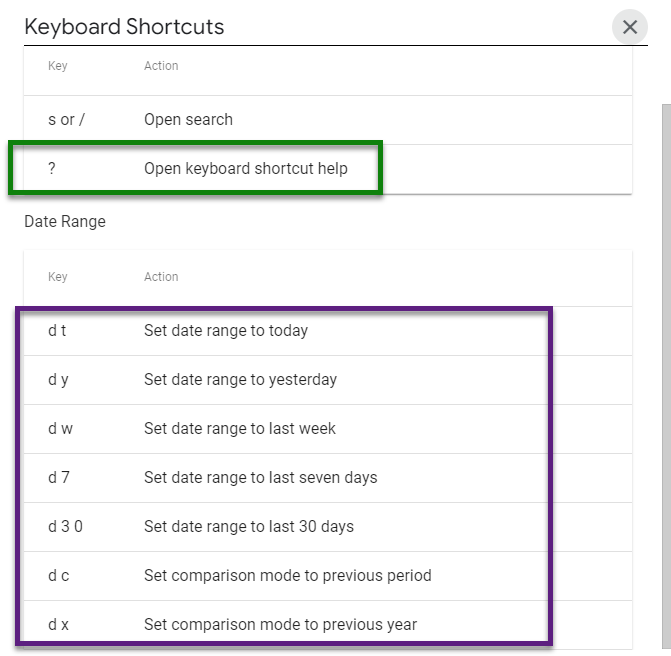
You can use them to quickly select the required dates. In general, I recommend using a long enough period (at least a few weeks) when doing this conversion path and attribution analysis.
2. Conversion Events
In most cases you want to limit your conversion paths analysis to one single conversion event.
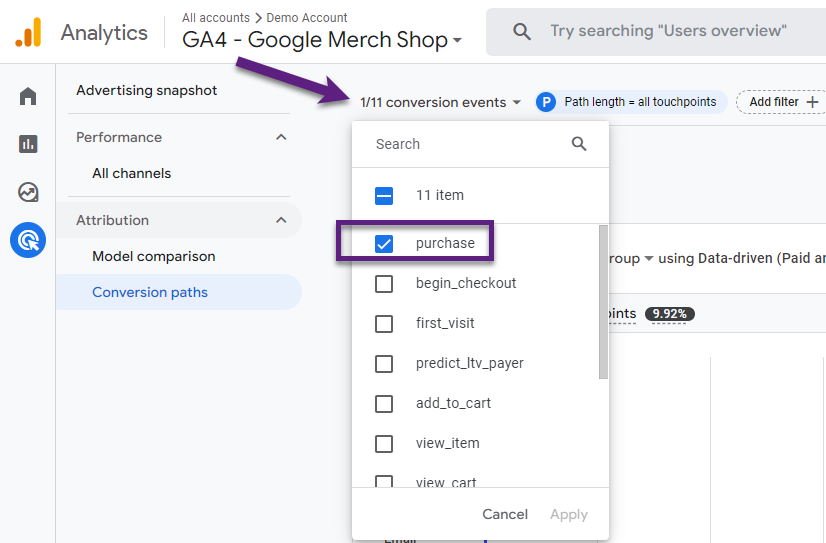
For example, your analysis wouldn’t make a lot of sense it you include 11 different conversion events. For Google, an E-commerce store, it sounds logical to only select the ‘purchase’ event.
The macro goal of your website is most often the leading one in this type of analysis.
3. Path Length
On default, all user purchase journeys are included (up to 20 touch points).
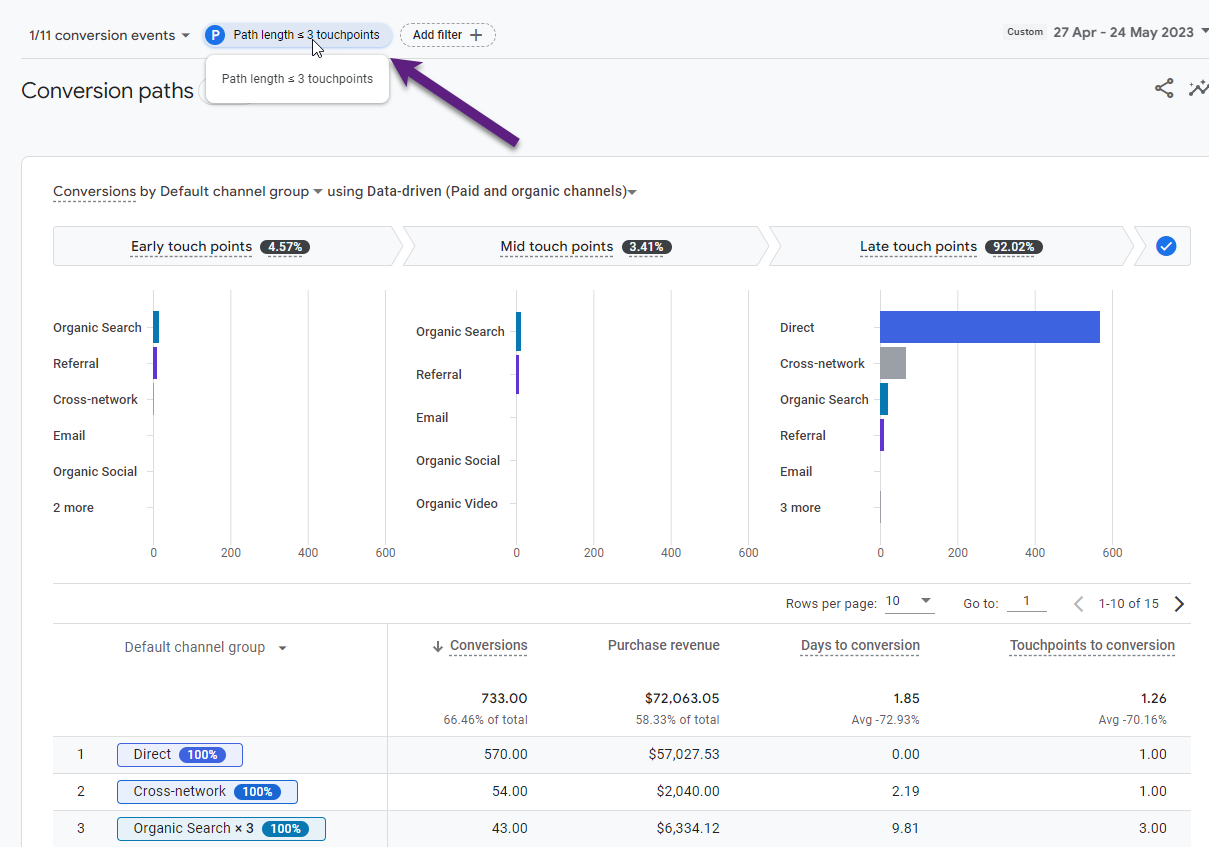
You can modify the content and outcome of the report. Let’s assume you want to only review the conversion paths for user purchase journeys having less than or equal to three touch points.
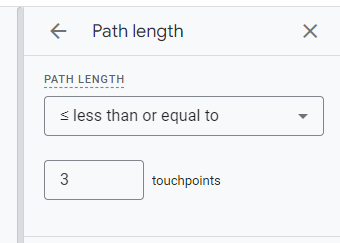
And below you can find the new report.
4. Filters
You can make a more granular conversion paths analysis by applying a filter with one to five conditions.
Here is an example of a filter with two conditions:
- First user default channel group = Organic Search
- Country = United States
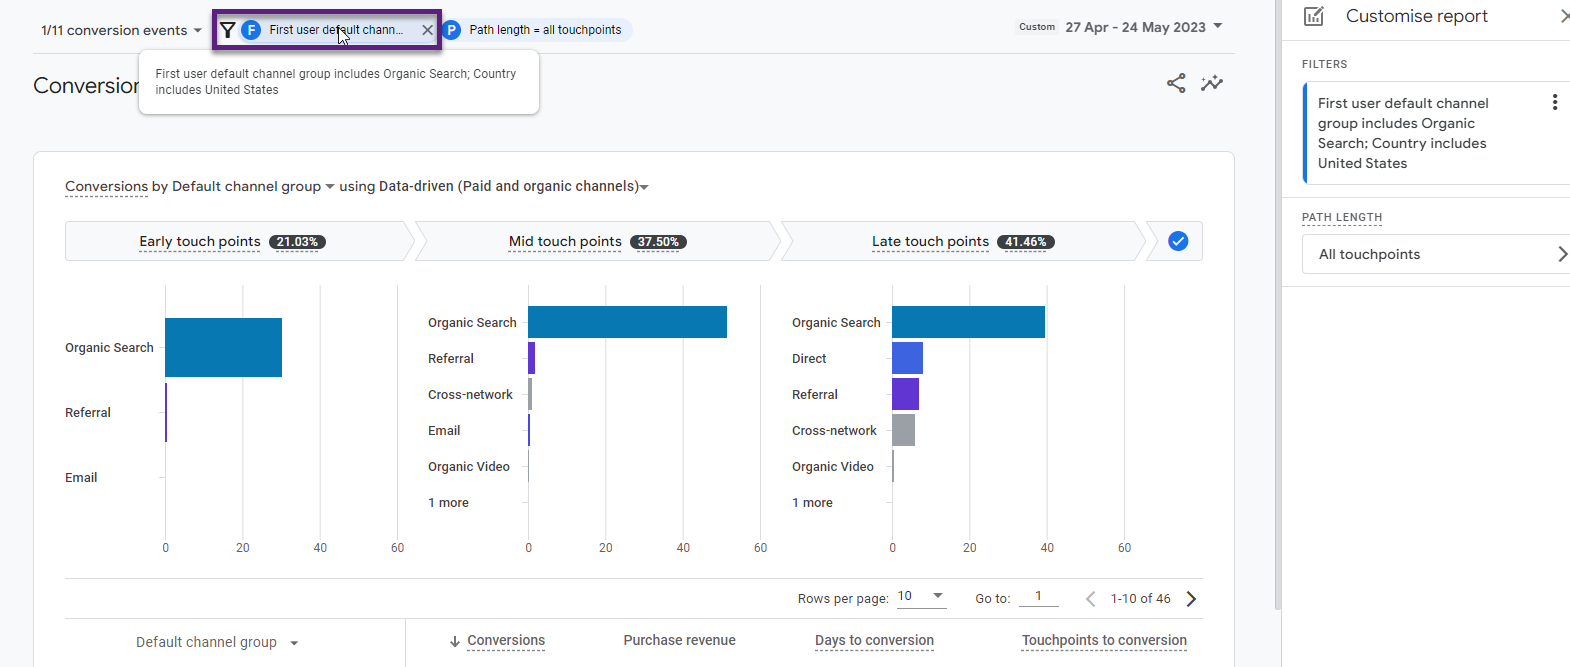
It’s always important to ask (yourself) questions before setting up an analysis. And this is even more important the more granular you get with attribution analysis or another advanced data analysis.
5. Conversion Source Dimension
At the time of writing you have four different options when it comes to the conversion source.
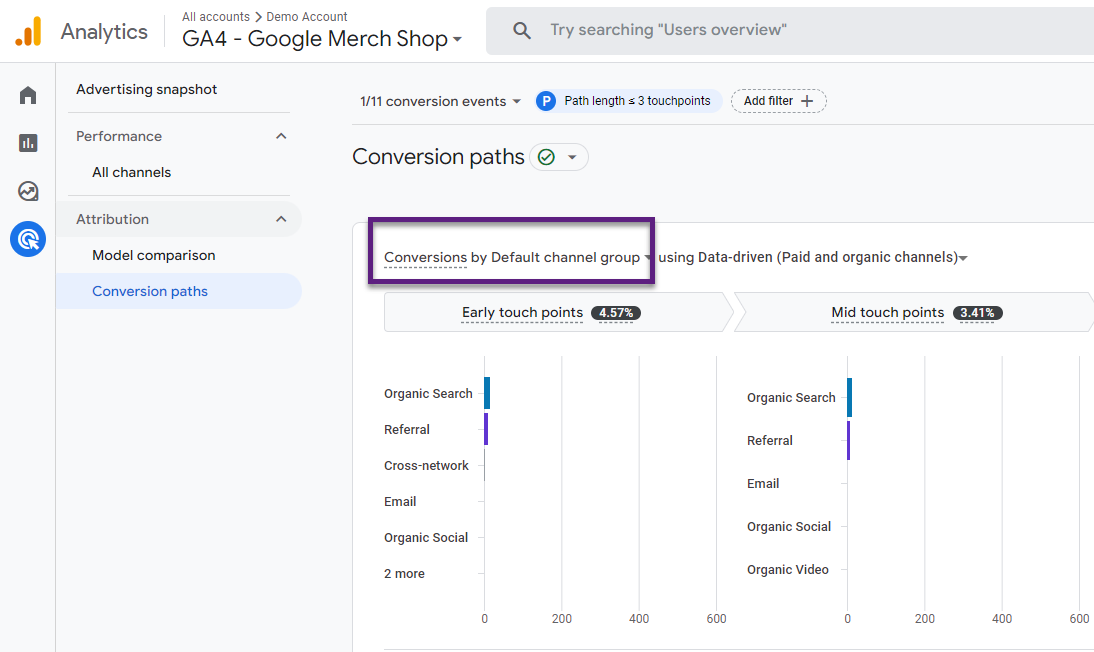
On default, the conversion source is set to ‘default channel group’. You have three other options:
- Source
- Medium
- Campaign
It depends on your implemented (UTM) tracking, but getting too granular here might not bring the desired insights in performance.
6 Applied Attribution Model
On default, the Attribution model is set to Data-Driven attribution.
From September, the only two other options are Cross-channel (non-direct) or Ads preferred last click.
In a lot of cases I like to work with Data-Driven attribution instead of the other two models still available from September’23.
7. Rows per Page
Google allows you to increase the rows per page from 10 to 250 max.
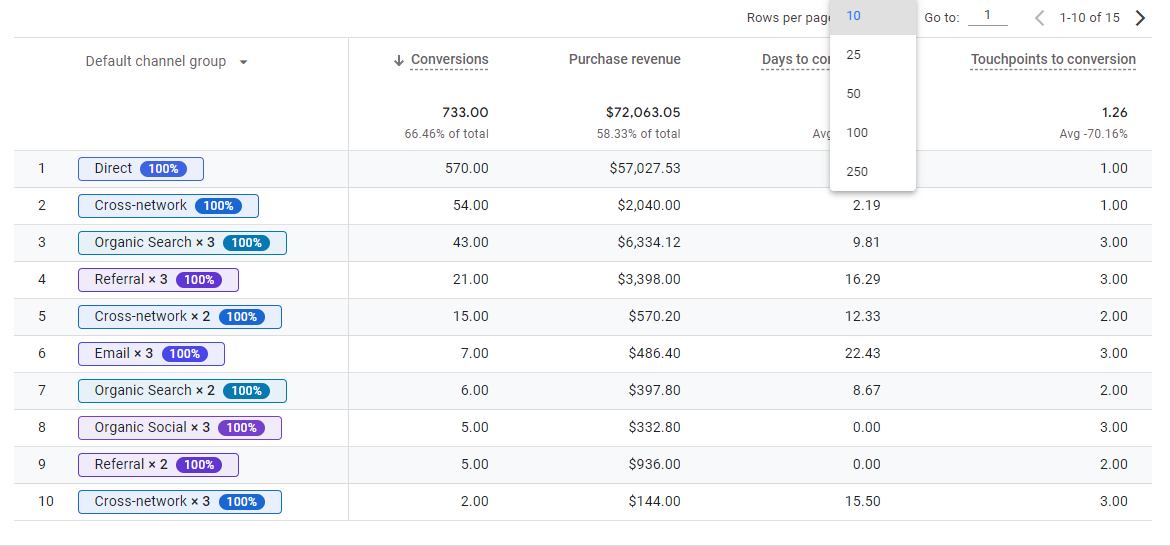
In addition, you can use ‘pagination’ to start at a certain row, i.e. 12.

GA4 Conversion Path Insights
Potentially, you can get many different insights from the conversion path report in GA4.
Here are three types of insights:
- Channel role in purchase journey.
- Device-level attribution per channel.
- Top conversion paths.
I will discuss them in more detail below.
1. Channel Role in Purchase Journey
For the top channels, visible on top (screenshot below) it is possible to get a good understanding of channel role and how it attributes to conversion.
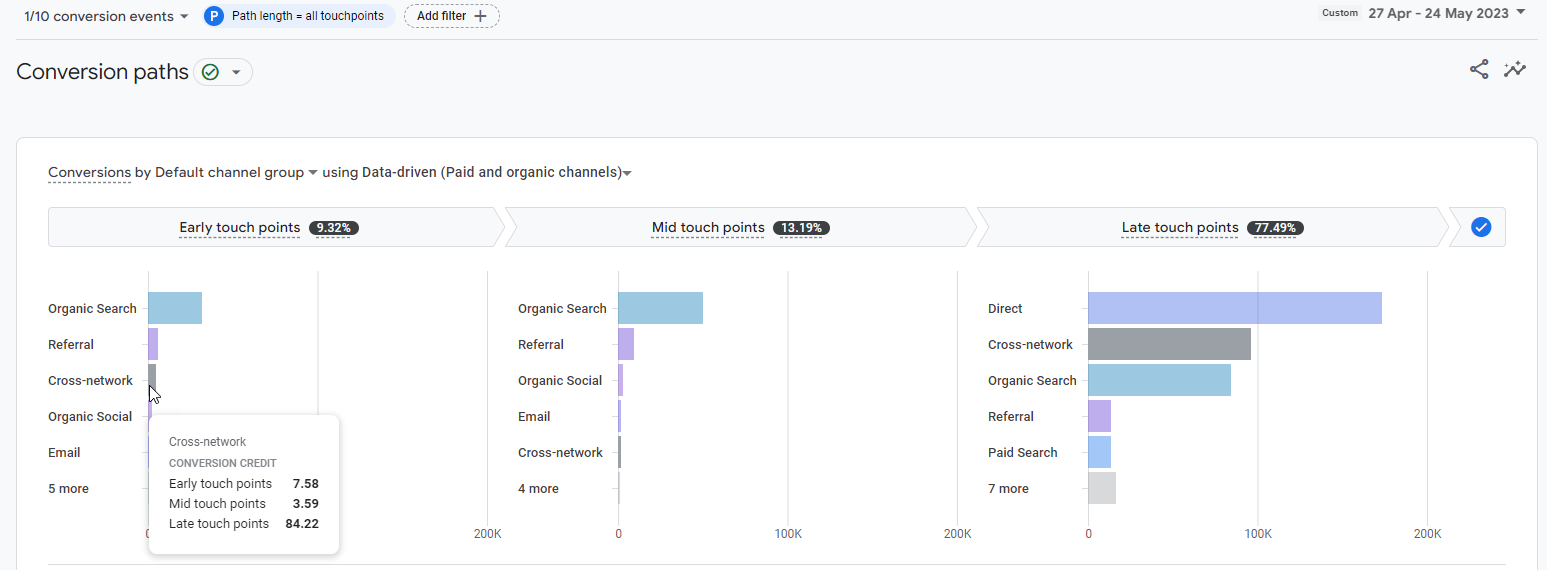
In the example above I hover over ‘Cross-network’.
- The data visualization clearly indicates that ‘Cross-network’ is strong in closing conversions.
- On the other hand, its role as an initiating or assisting channel is very weak.
By doing this exercise you can quickly learn more about your channels and each predominant role(s).
The downside of this visualization is that Google doesn’t display the exact values of all channels, but only the top five in each chart.
2. Device-Level Attribution per Channel
Let’s assume you like to see whether performance on ‘Desktop’ deviates from ‘Mobile’ for the Cross-network channel. In this case User ID (measuring across multiple devices is not implemented).
You can use filters to include only data from a specific segment.
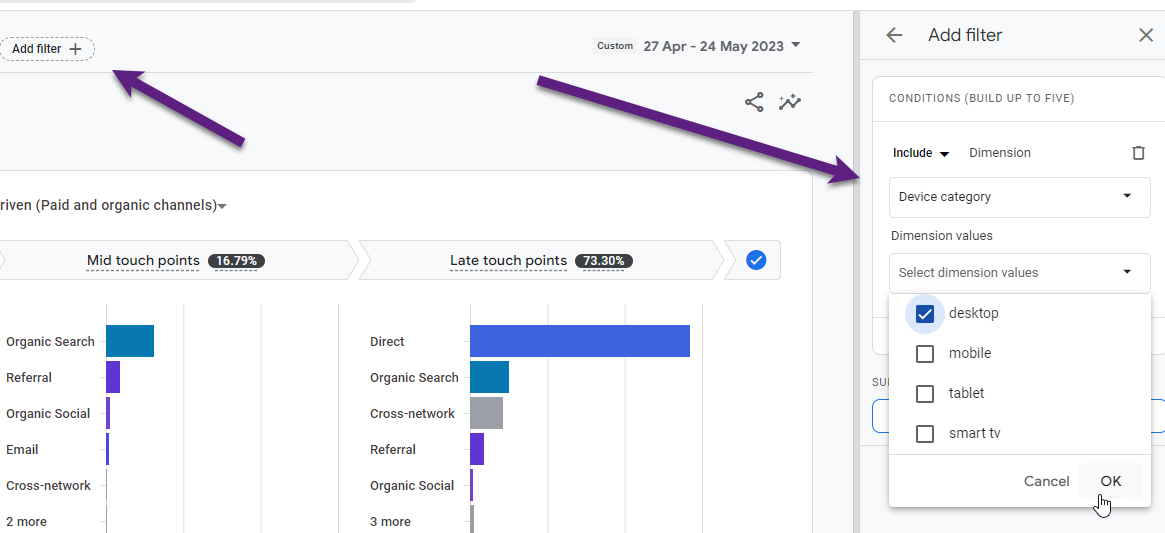
Here are the results (absolute and percentage). 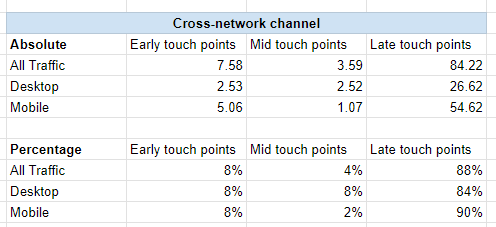
And here is the visualization for easy review.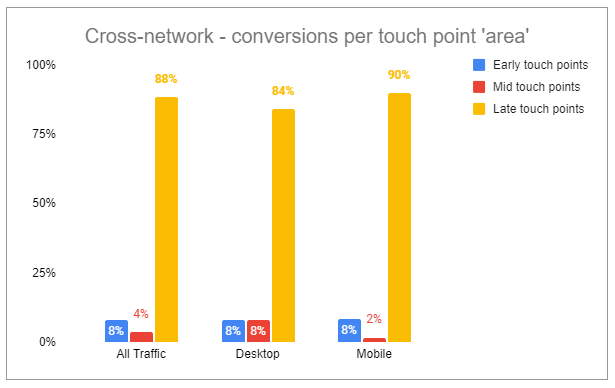 Conclusion:
- On both Desktop and Mobile, the Cross-network channel is by far the strongest in closing conversions (purchases).
- On Mobile, it tends more strong towards closing where on Desktop more assisted conversions are measured.
3. Top Conversion Paths
The chart below allows you to analyse the top (10) conversion paths in more detail.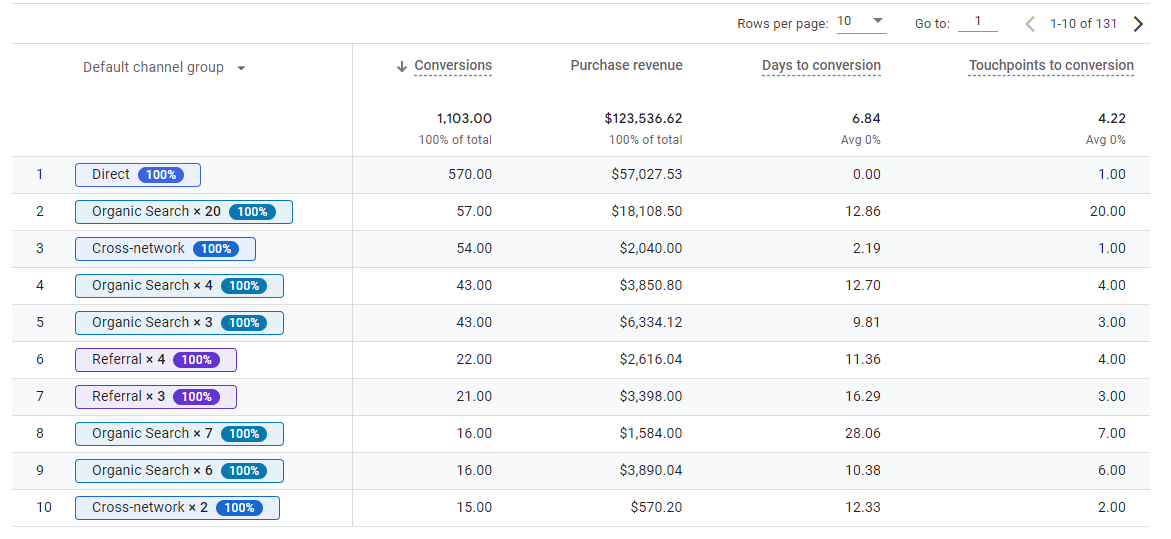 For the Google Merchandise Store (27 Apr – 24 May, 2023) it turns out that:
- Direct takes credit for over 50% of the purchases (sounds like an implementation issue).
- Many conversion shows a (relatively) long path to conversion (in terms of days and touch points). ‘Organic Search x 20’ also sounds like a measurement issue.
- The top 10 conversion paths (less than 10% of all paths) are good for 80% of all conversions (impacted by skewed Direct conversions).
This is just the tip of the Iceberg and you can gain many, many more insights if you ask the right question before digging into this report in more detail.
Concluding Thoughts
The GA4 Conversion Paths report is a welcome addition to the set of native reports available in the standard GA4 reporting UI.
Most companies can benefit from using this report and the Attribution section in general, but it is not the holy grail. Keep in mind that Attribution is becoming increasingly difficult.
It would be great if the options for analysis grow over time so that you can further customize it and analyse everything in more depth. Compared to Universal Analytics, the Attribution section is relatively small and you won’t find the same reports as in UA.
By now you know how the report works, what settings are available and how you can gain particular insights by applying several analysis techniques.
This is it from my side! What do you think of the Attribution section in GA4 and in particular the Conversion Paths report?
One last thing... Make sure to get my automated Google Analytics 4 Audit Tool. It contains 30 key health checks on the GA4 Setup.
Leave a Reply