In UA, the Ecommerce conversion rate was one of the popular metrics. In GA4, this metric is not available by default, but you can still access it via default reports and Explore.
In my experience, the majority of Ecommerce shops and non-Ecommerce shops with GA4 Ecommerce implemented, want to report on Conversion Rate metrics. Currently, you need to take a couple of steps before you can see this metric in the GA4 UI.
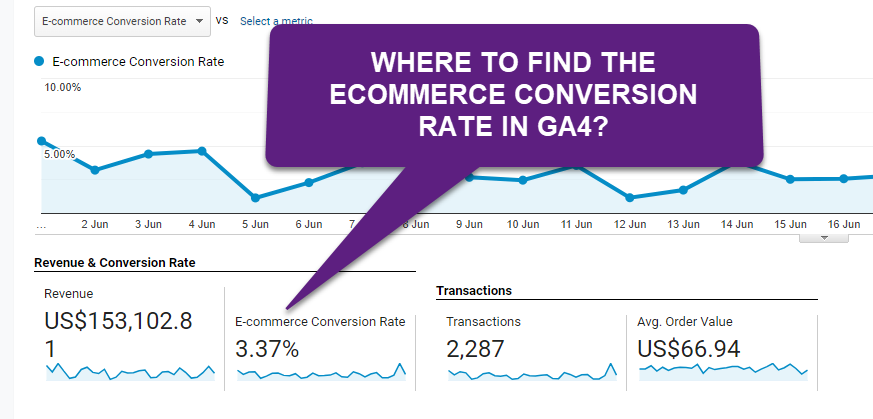 In the previous blogpost we ran through conversion rates and GA4 where in this blogpost I will introduce you to Ecommerce conversion rate metrics in GA4.
Table of Contents
I will start with a general introduction to Ecommerce conversion rate and GA4.
Ecommerce Conversion Rate
The Ecommerce conversion rate (Ecom CVR) in Universal Analytics (GA3) is based on sessions. In other words, in what percentage of sessions does the user convert?
In my blogpost about the conversion rate in GA4, you can read about both session as well as user level conversion rates and the benefits of using both. You will get much more context around user behavior and conversions if you analyze these CVRs on both scopes.
Our goal in this blogpost is to demystify the Ecommerce conversion rate in GA4 at the session and user level.
Standard Reports
Adding the Ecommerce conversion rate metric to GA4 in standard reports requires a few, easy steps.
Review this part of my Conversion Rate in GA4 article to exactly learn how to do this.
In short, here are all steps you need to follow:
- Navigate to ‘Traffic acquisition’ within the reporting UI.
- Click on ‘Customize report’ in the top right corner.
- Click on ‘Metrics’ under report data.
- Click on ‘Add metric’ link.
- Search for and add ‘Session conversion rate’; click on Save.
- Save changes to the current report.
- Review the new metric in your report.
- Under ‘Session conversion rate’: change ‘all events’ to ‘purchase’.
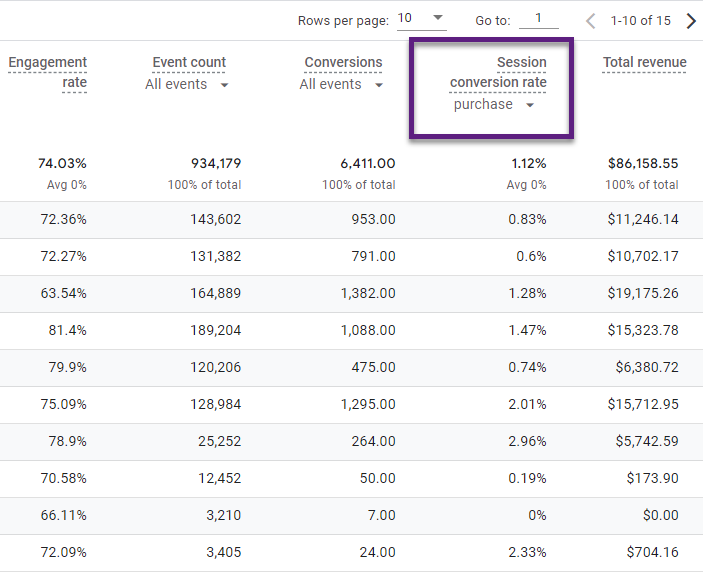
Keep in mind:
- Edit or administrator access is required for making these changes.
- You need to add this metric to every report where you want it to appear.
- You can change the order of the metrics; i.e. you can list it next to the ‘Conversions’ metric.
- The ‘user conversion rate’ metric is also available for you to include in a report of your choice.
Explorations
At the surface, it seems impossible to have the Ecommerce conversion rate metric in an Exploration in GA4.
Currently, there is no native Ecommerce conversion rate in GA4.
But, you can apply a few tricks to see this metric in your reports.
You will find more details about the setup below, but this is how the final report looks like:
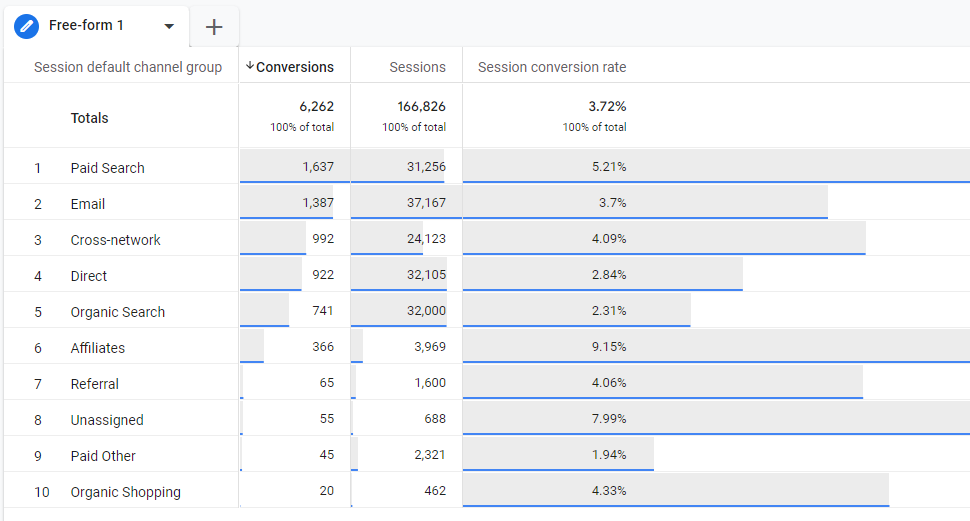
Let me explain a bit more about the setup (you can tweak it and include additional/other metrics and dimensions where needed).
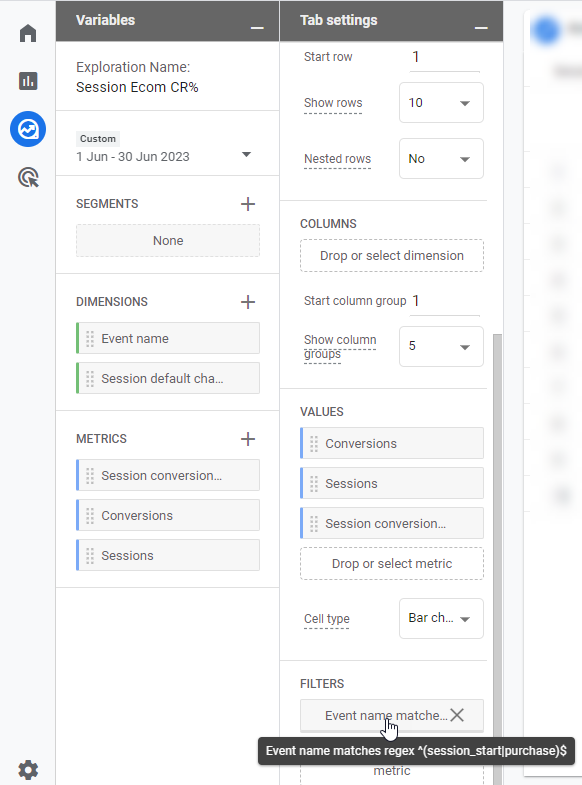
Ecommerce Conversion Rate Report Setup
Here you will find the exact setup of the GA4 Ecommerce conversion rate report.
Dimensions
- Event name – required, as you need to use it as part of the filter
- Session default channel grouping – optional, you can include it to segment the Ecom CVR at the channel level
Rows
Add the ‘Session default channel grouping’ here. ‘Event name’ is not required as it solely functions as a filter.
Metrics
- Session conversion rate – required, as you transform this metric into the Ecommerce conversion rate in GA4
- Conversions – optional, you can include it to provide more context around the Ecom CVR
- Sessions – optional, you can include it to provide more context around the Ecom CVR
Values
Similar to ‘Metrics’; the only difference is that by having them here you actually see them in the report.
Also, the order is a bit different:
- Conversions (sort order = descending)
- Sessions
- Session conversion rate
The above setup reflects the importance of each channel in terms of transaction volume.
Filters
This is the most tricky part.
- Event name matches regex ‘^(session_start|purchase)$‘
Note: you need to add the ‘purchase’ AND ‘session_start’ event to include all sessions and not only those with a purchase.
Caveats with ‘session_start’ Event
Most people might not know, but not all sessions include the ‘session_start’ event (below).
You will see this when you create a segment within the Exploration.
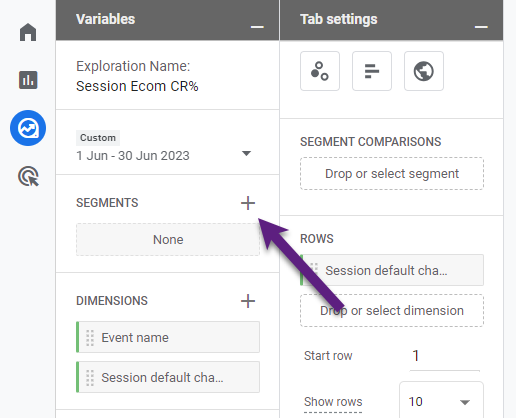
And here is the segment (you can review the details before saving).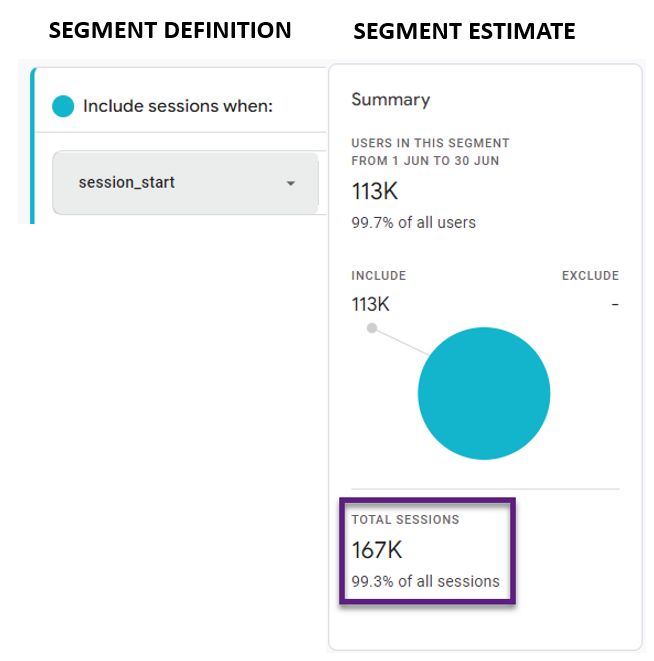 Basically it means that the reported numbers in your Exploration might deviate a bit from what you see in the standard reports, but the difference is minimal.
Here is an example (numbers are based on six months of data):
Exploration vs Standard report
- Conversions (Transactions): 38529 vs 38529
- Sessions: 1158973 vs 1164512
- Session conversion rate (Ecom CVR): 3.32% vs 3.31%
As mentioned, the impact is minimal, but as an Analyst it is always good to know what is causing minimal differences in some cases.
User Ecommerce Conversion Rate Report
Simply replace the ‘Session conversion rate’ metric by ‘User conversion rate’ and add a few user-scoped dimensions and metrics to analyze the user Ecommerce conversion rate in GA4 in an Exploration report.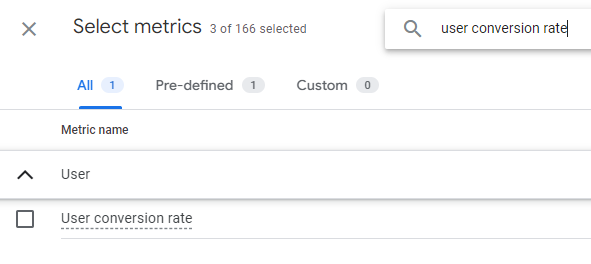 Here are the numbers based on six months of data:
Exploration vs Standard report
- Conversions (Transactions): 38529 vs 38529
- Total users: 756971 vs 761059
- User conversion rate (Ecom CVR): 4.89% vs 4.87%
You will see that the difference between the User-scoped Ecommerce conversion rate in an Exploration and Standard report is negligible again.
There is one more detail I need to share:
“You can’t calculate the Ecom CVR as ((Transactions / Total users) * 100%); you would need to create a segment reflecting the Users w/ Purchase and divide it by Total users instead.”
I hope you are still with me! Let’s dive into Looker Studio in the next section.
Looker Studio
Tip: use GA4SPY to find out details about metrics and dimensions available in GA4.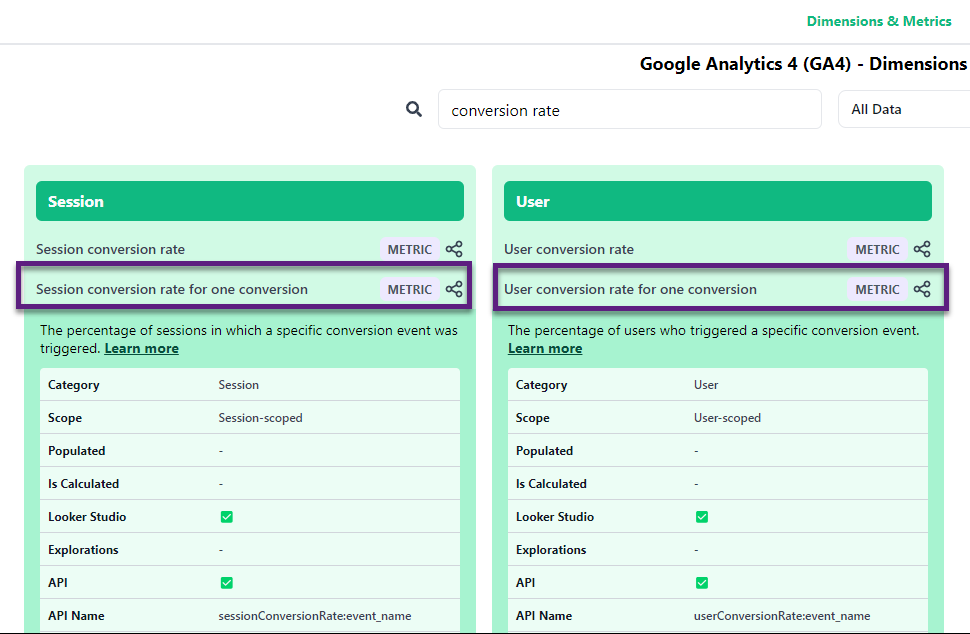
It shows us there are specific Conversion Rate metrics available in GA4. And that they are not available in Explorations (yet).
Opening Looker Studio will also reveal these metrics. But, the report breaks when you try to add these type of metrics: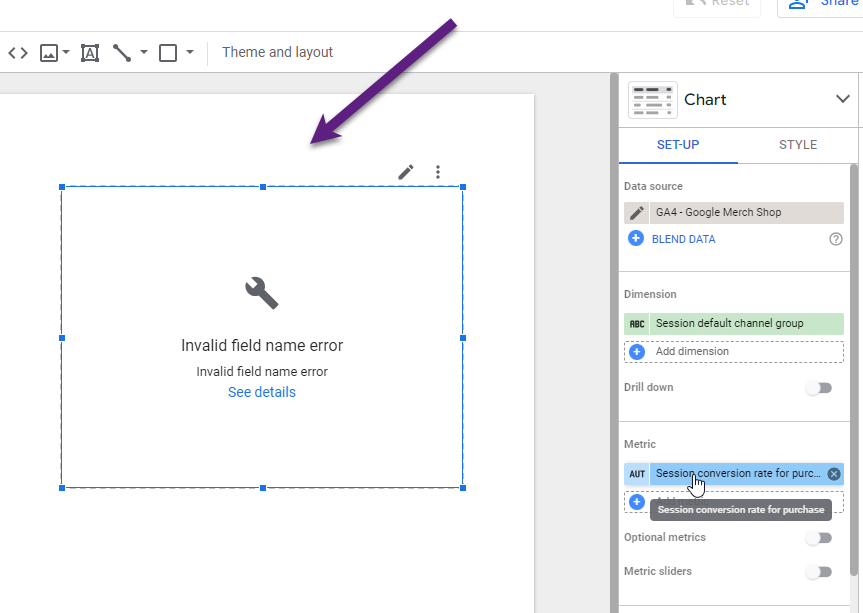
In this case, instead of trying to fix the error above, I prefer to create a calculated metric directly in Looker Studio.
You can do this via the ‘Chart setup’ environment as shown below.
Step 1: remove the metric that throws an error and click on ‘CREATE FIELD’.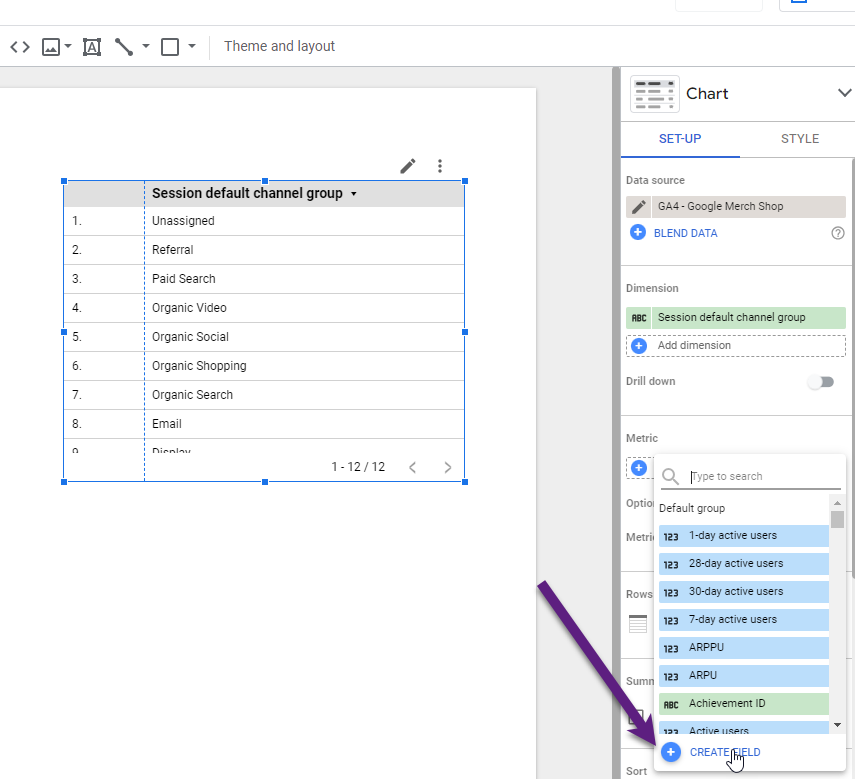
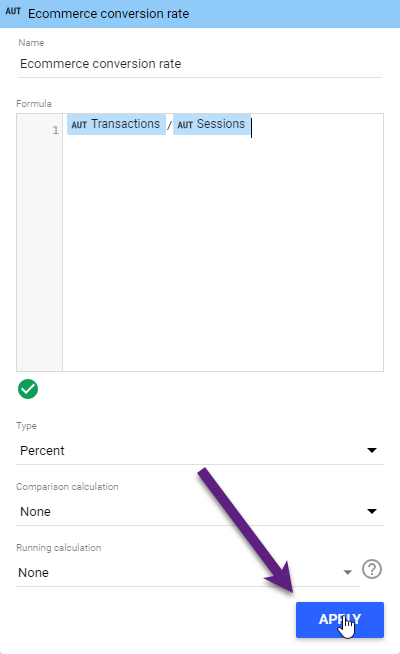
Step 2: create the new metric definition and click on ‘APPLY’.
 Step 3: review your report and Ecommerce conversion rate.
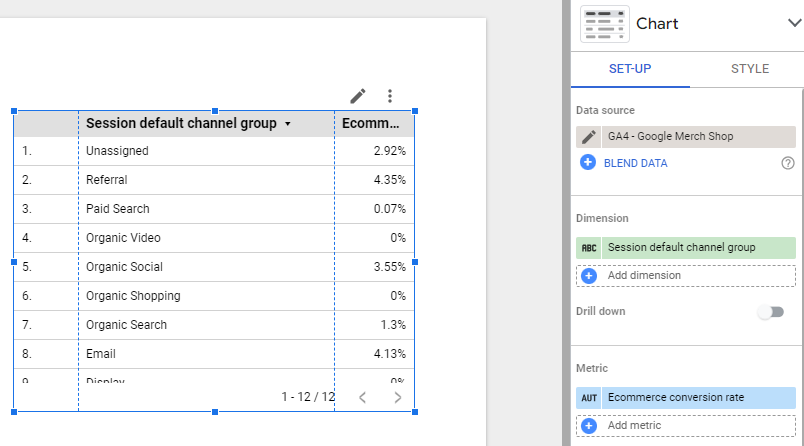 There you have it! No error and everything works as expected.
As a final step, I recommend changing ‘Number’ to ‘Percent’ if you like to use it in other reports as well.
You need to go to ‘Manage added data sources’ to do so.
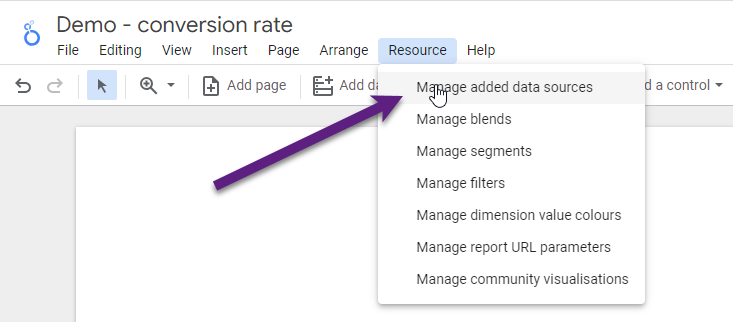
You will see the screen below after clicking on ‘edit’ GA4 – Google Merch Shop.
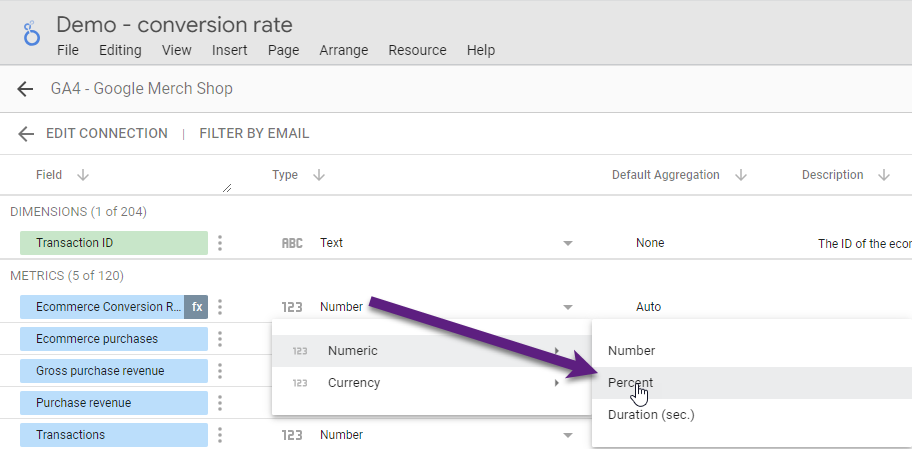
- Change ‘Number’ into ‘Percent’.
- Add a ‘Description’ if helpful for you and your team.
Creating an accurate ‘user-scoped Ecommerce conversion rate’ would require a few additional steps which go beyond the scope of this article.
Read this article if you want to learn more about calculated fields in Looker Studio.
Additionally, you can work with Google Sheets and first feed your GA4 data into Google Sheets before connecting it to Looker Studio. Your options are endless!
And, if you are skilled enough, BigQuery might come in handy as well.
Concluding Thoughts
Working with Ecommerce conversion rate metrics in GA4 isn’t that easy as long as they are not natively available.
By now you know what strategies to apply to set up and analyze Ecommerce conversion rate metrics in a variety of place:
- Standard reports
- Explorations
- Looker Studio reports
Getting a deeper understanding of GA4 and how it works will empower you and your organization in getting the most out of this platform.
This is it from my side. As always, I am curious to hear about your experience and struggles (if any) when trying to analyze and optimize your business and conversions with GA4.
One last thing... Make sure to get my automated Google Analytics 4 Audit Tool. It contains 30 key health checks on the GA4 Setup.
Leave a Reply