The Channels report and Default Channel Grouping dimension come with critical insights for any business. Most companies get the setup terribly wrong and don’t use it to its fullest potential. Let’s demystify the Default Channel Grouping together!
I believe for nearly all online businesses this should be one of the first reports and dimensions to take a look at in Google Analytics:
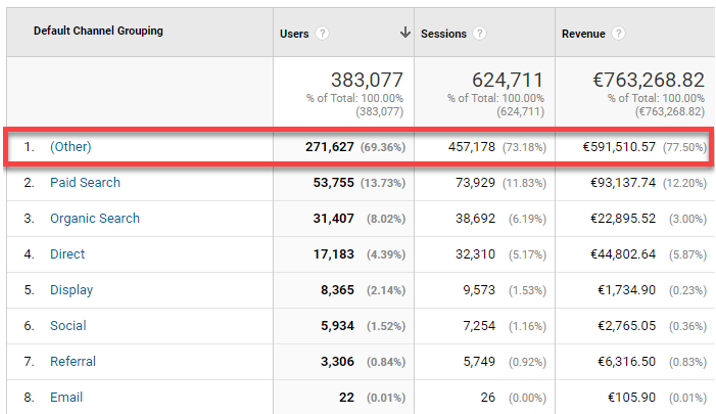
It can be a great help in making a high-level, performance analysis for your business.
In this post we’ll both discuss the setup as well as analysis strategies beyond the Channels report and Default Channel Grouping dimension.
Table of Contents
- Prerequisites
- Default Channel Grouping Definitions
- DCG vs. Custom Channel Grouping
- Default Channel Grouping Setup
- (Other) Channel
- Default Channel Grouping Insights
- Concluding Thoughts
Prerequisites
Any business that has one or more digital properties (e.g. website) should carefully measure their conversions.
Most reports won’t be that useful if you can’t correlate your standard data and dimensions to conversions happening your site. And the same is true for your Default Channel Grouping and Channels report.
Goals
The first type of conversions you can set up in Google Analytics are goals.

Basically, there are two goal types in terms of importance:
- Macro goal: primary goal / conversion on a website.
- Micro goals: secondary goals on a website.
I highly recommend defining at least two or three goals on your website. There is always more than one reason why your website exists (in the eyes of your visitors).
In some cases you don’t need any dev resources to get your goals set up in Google Analytics. However, some websites require implementation changes to get all goals set up. For example, setting up Events that cannot be directly implemented via Google Tag Manager.
Read more about goals:
Ecommerce
For transactional websites it is a no-brainer that you want to implement Enhanced Ecommerce on your site. But also on non-transactional websites there are a ton of use cases where you can benefit from implementing this powerful module.
Rule of thumb: don’t define goal values on reporting views where you enable Enhanced Ecommerce. This will skew your value metrics in GA.
Enhanced Ecommerce not only comes with measuring transactions, but also prior steps of the purchase funnel. For the Google Analytics Channels report to be useful, you should implement transaction tracking at a minimum.
Most probably you need to involve your dev department to get Enhance Ecommerce implemented on your site. You won’t regret it as you can potentially get a ton of extra ecommerce insights.
The setup (admin) in Google Analytics is a breeze (once the tech stuff is in place):
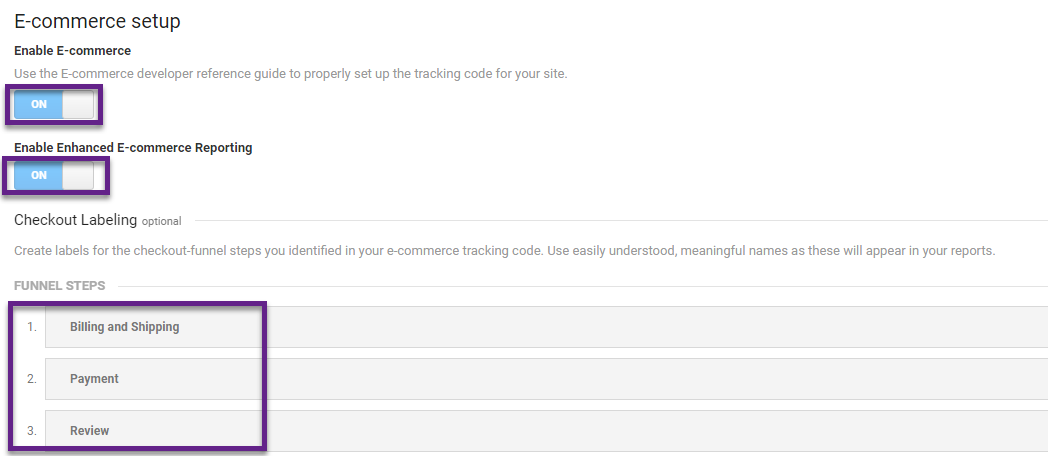
Keep in mind:
- Setting up goals is a must.
- Implementing Enhanced Ecommerce is very useful, but not always required or within reach.
Default Channel Grouping Definitions
Here is the Channels report (dimension: Default Channel Grouping) of the Google Demo Store:
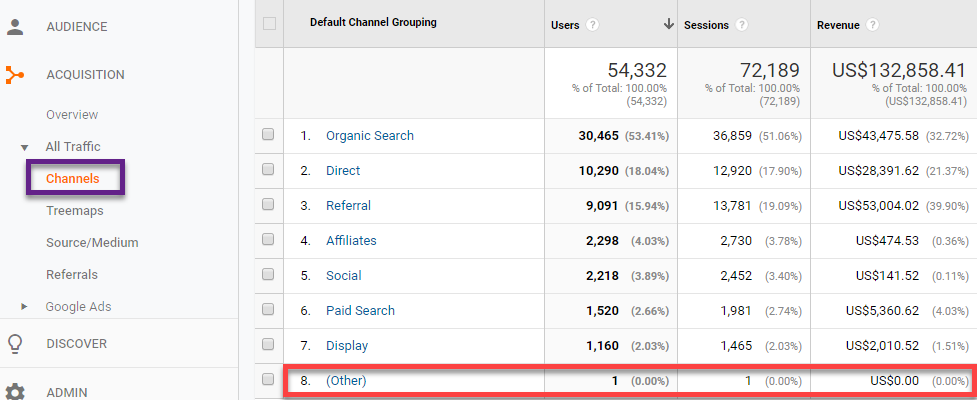
- All traffic is allocated to a certain channel based on “system-defined” rules.
- You can modify the Default Channel Grouping in the admin section (at the view level).
- All traffic that doesn’t match a channel rule flows into the (Other) bucket.
I recommend reviewing the list of default channel definitions before proceeding to the next chapter:
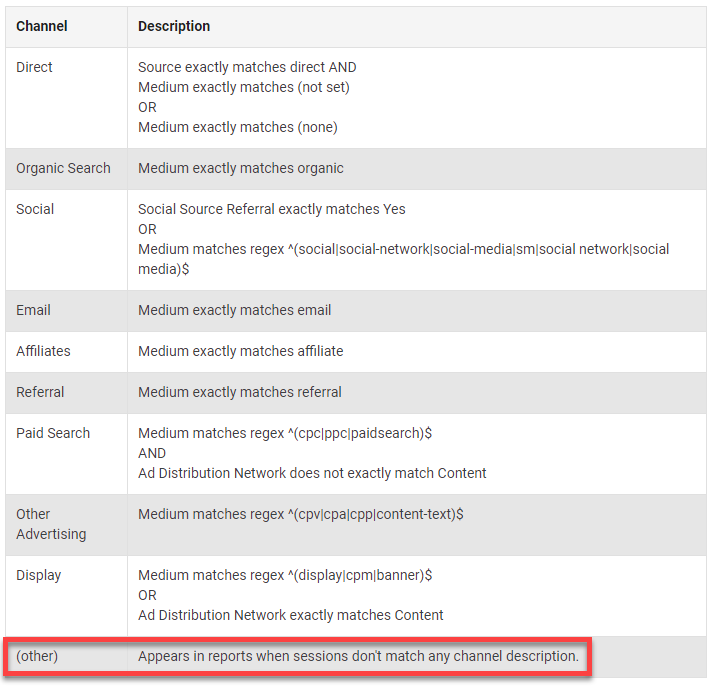 Key rule: you want to keep the (Other) bucket as small as possible (at least below 2%).
Pro tip: define a segment (sessions or users in (Other)) and connect it to a custom alert in- or outside of Google Analytics.
You can drill-down on the (Other) dimension value to find out which sources are not correctly attributed. And then modify the rules to regain your confidence on the setup. However, these rules don’t work retroactively on your already collected data.
DCG vs. Custom Channel Grouping
In this post I won’t explain all details on Custom Channel Groupings, just keep in mind that this feature exists as well.
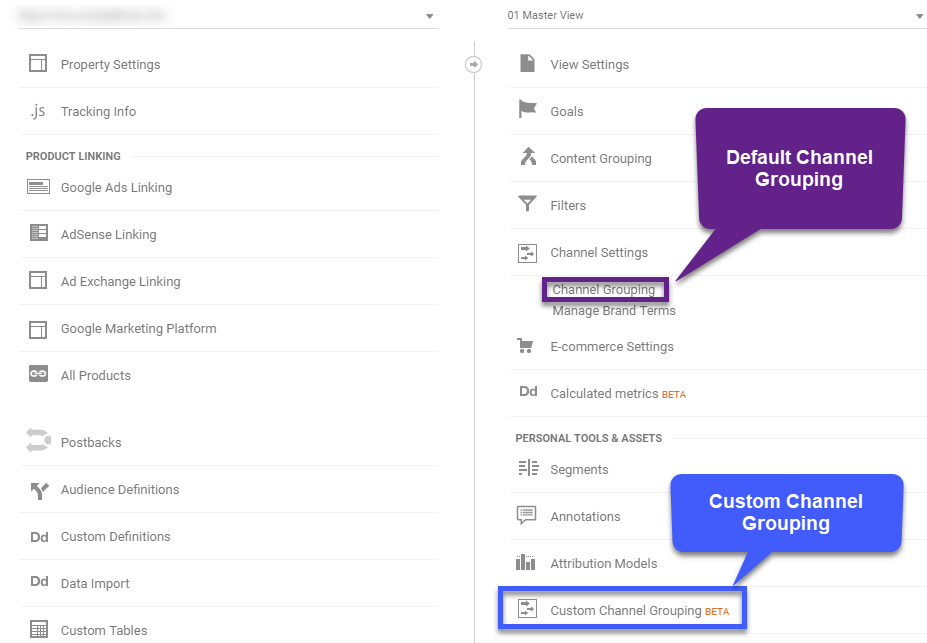
Default Channel Grouping
In my opinion this is the most important Channel Grouping to focus your efforts on. As this is the only customizable channel grouping that’s available via the Google Analytics Reporting API. Will explain more about this later in this article.
Only experienced GA users should modify the initial setup as it permanently changes the raw data for new sessions by altering how Google Analytics labels incoming traffic sources. And this is why many people, including Google :-), are stressing not to modify it, but create a copy instead.
Here is how you can use the Custom Channel Grouping as a safety check:
- Replicate the setup of the Default Channel Grouping before making any changes.
- Prior to making any changes, test them out via the Custom Channel Grouping.
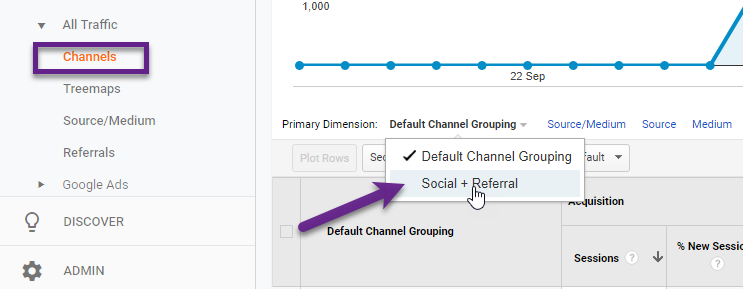
You will find it below the “Default Channel Grouping” dimension value in the Channels report. This is how you can quickly check how the data will change (in the future) once you apply a change to the Default Channel Grouping setup. You can also leverage a Test View for this matter.
Default Channel Grouping Setup
We will discuss them in a moment, but you can work on the Default Channel Grouping setup in three different ways:
- Split an existing channel.
- Modify an existing channel.
- Add a new channel.
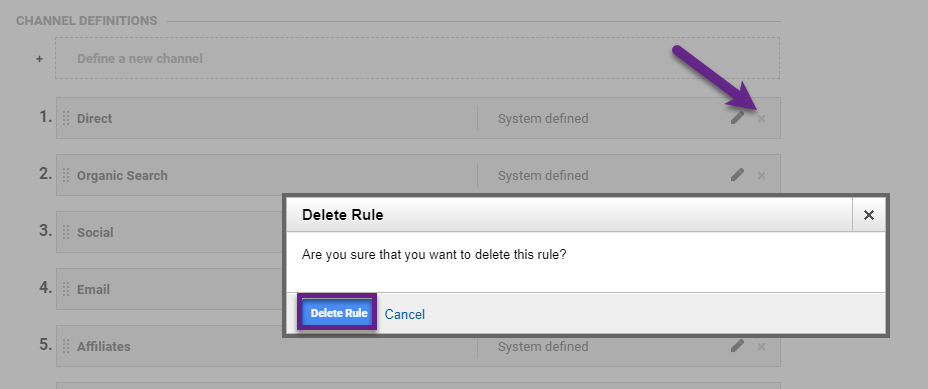
Deleting a channel is something I won’t discuss in detail, but you can simple do this (think twice first!) by hitting the “cross” and confirming your action.
Split an Existing Channel
At a minimum you should split branded and generic paid search queries (if you run paid seach campaigns).
Google has made it very easy for you with this “Manage Brand Terms” setting:
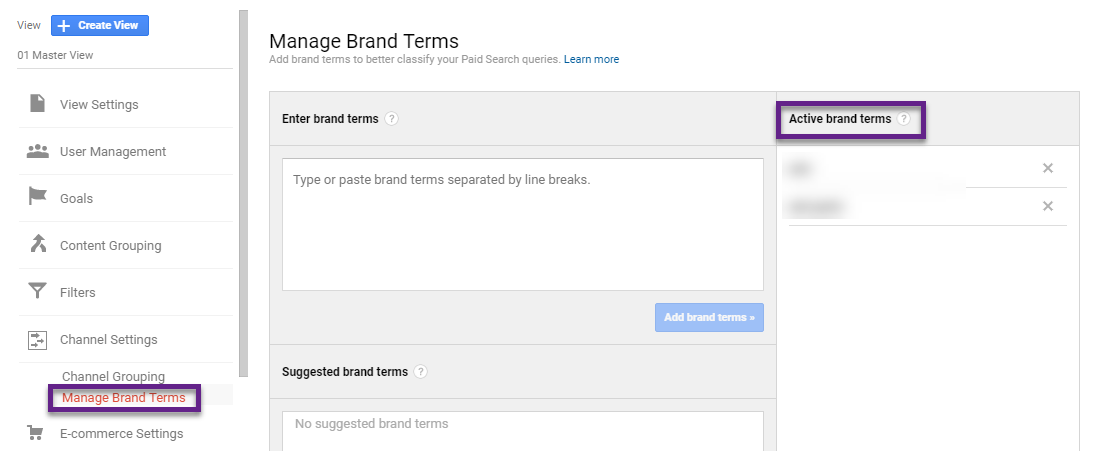
After adding your brand terms, Google will automatically divide your Paid Search queries into branded and generic.
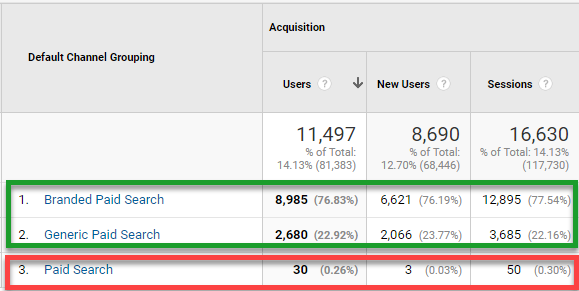 This is very helpful when you want to analyze and segment on your Paid Search campaigns. You can correlate the query types to Acquisition, Behavior and Conversion metrics.
And, with a more complex approach, you can look into multi-channel performance and/or attribution models for your business.
Modify an Existing Channel
Campaign tracking is at the heart of the Channels report. Most companies get this wrong.
And believe me, making mistakes on your UTM parameters will ruin your Default Channel Grouping dimension and Channels report.
First rule: don’t settle for a Band Aid Approach.
Let me explain this with an example:
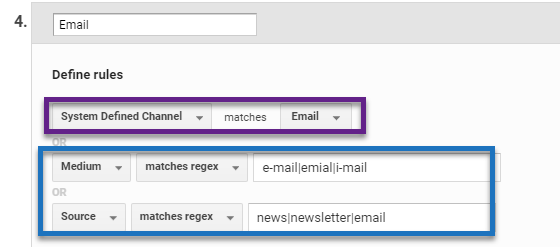
I am exaggerating on purpose here.
- At the beginning of this post you saw the medium matches email is bucketed into channel “Email”.
- This corresponds with the purple line in the example above.
- In blue you can find additional statements that are used to mitigate misspellings and inconsistencies in UTM parameters to still attribute this traffic to the channel “Email”.
- This is ok as long as you do everything you can to solve the issue at the core (UTM parameters for Source/Medium).
Second rule: use a spreadsheet (or other document) to share and unify Campaign Tracking within your organization.
I can’t stress enough that accurately tagging and tracking your campaigns is one of most important aspects of getting insights for your business.
Add a New Channel
It really depends on your business, but the initial Default Channel Grouping setup might not be accurate enough to catch all the traffic sources for your business.
You can easily set up a new channel if that’s the case.
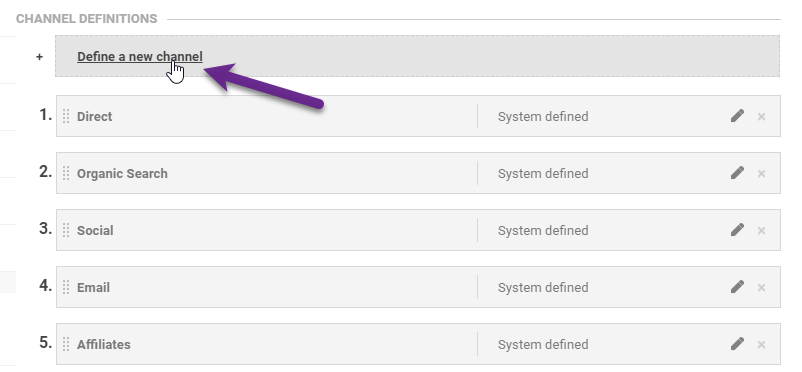 Click on “Define a new channel” and set up the rules for which traffic to attribute to your new channel.
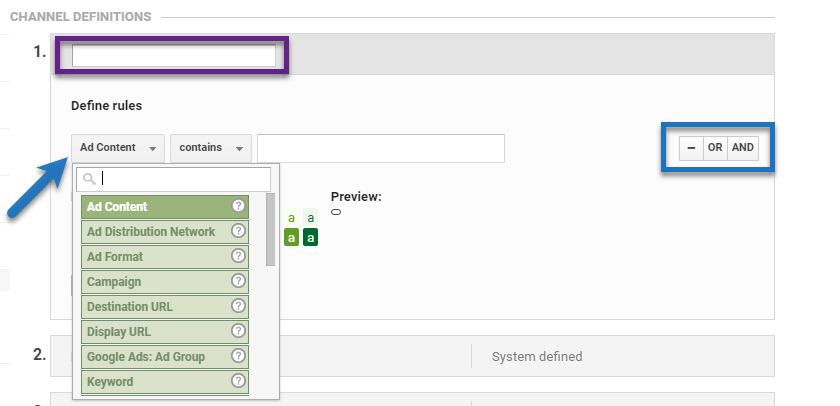
- In most cases companies use the UTM parameters Source and/or Medium to define a new channel.
- As you can see, you are not limited to using only these parameters.
- Make sure it is all set up in line with how you have tagged campaigns that belong to this channel.
Third rule: get the setup right from the start.
Before launching a new campaign (that should be grouped in a new channel), think about and implement the new channel setup. This prevents you from sending traffic into the wrong channel or (Other) bucket.
Fourth rule: channel order really matters (same as with admin filters).
New channels are automatically added on top of the channel processing list.
Keep in mind that Channels are processed in order. In other words, Google Analytics will evaluate a session and traffic source and starts evaluating it against rule 1, 2 etc. (and finally it could land in the (Other) channel).
You can use drag and drop to get your channels in the right order.
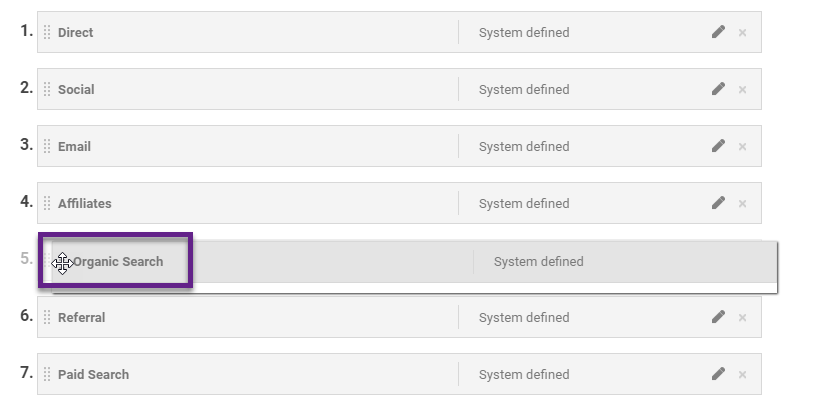 Pro tip: you save some processing (energy) resources by placing your main channels on top.
Last rule: don’t start modifying the Master View today if you lack experience.
You want to be really careful if you don’t have a lot of experience with the Default Channel Grouping. Start with Custom Channel Groupings and a Test View before you make any changes to your main view.
Mistakes can’t be undone retroactively.
(Other) Channel
Here are three steps to take to minimize the amount of traffic that flows into the (Other) channel.
Let’s assume you start optimizing the Default Channel Grouping setup from today.
Step 1: review the data of the Channels report in Google Analytics (last 30 – 90 days).
Go to Acquisition >> All Traffic >> Channels. (example for Google Merchandise Store)
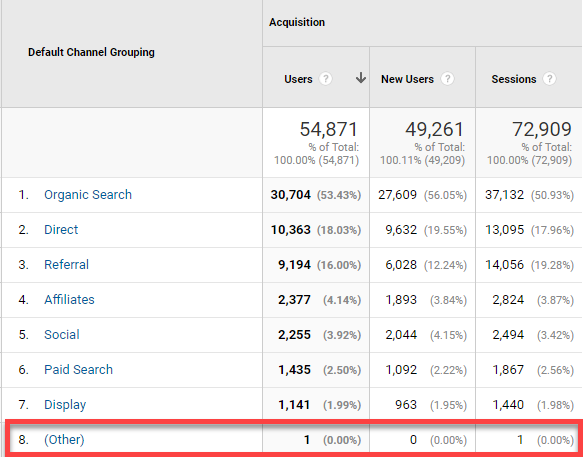
Very often you see a lot of more traffic flowing into the (Other) channel.
Step 2: drill-down on traffic in (Other) channel.
Click on “(Other)” and select “Medium” as secondary dimension.
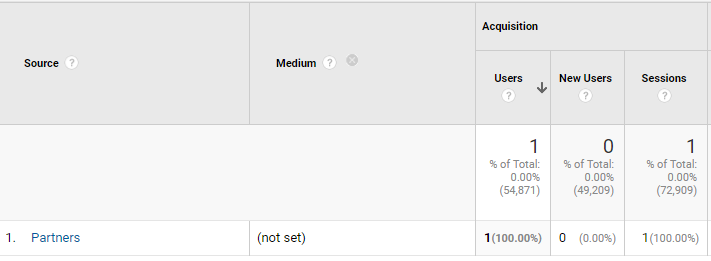 In this case the Source/Medium combination is not recognized by one of the Channels that are set up.
Step 3: attribute (Other) traffic to an existing or new channel.
Now it’s time to decide where you want to attribute the (Other) traffic to. You can either change the rules of an existing channel or set up a new channel.
Traffic sources that send a very small percentage (e.g. less than 0.1% of all traffic) aren’t crucial. It’s all about attributing important traffic sources and minimizing the (Other) channel stats.
Step 4: align your campaign tracking strategy with the Default Channel Grouping setup.
This is very important: make sure that your UTM parameters are in line with existing and new channels.
Rule of thumb: (Other) channel should stay below 2% of all traffic to your site, but far less is better of course!
Default Channel Grouping Insights
By now you are equipped with everything you need to correctly set up your Default Channel Grouping.
The exact setup depends on your business and all channels that are driving traffic.
Now it’s time to start working with the data.
High-Level Performance Analysis
The Channels report is one of the first reports that I analyze when starting to work with a new client.
- Transactional site: primary focus on Ecommerce metrics.
- Non-transactional site: primary focus on Goal metrics.
Here is an example of the Google Demo Store.
Acquisition, Behavior and Conversion Metrics
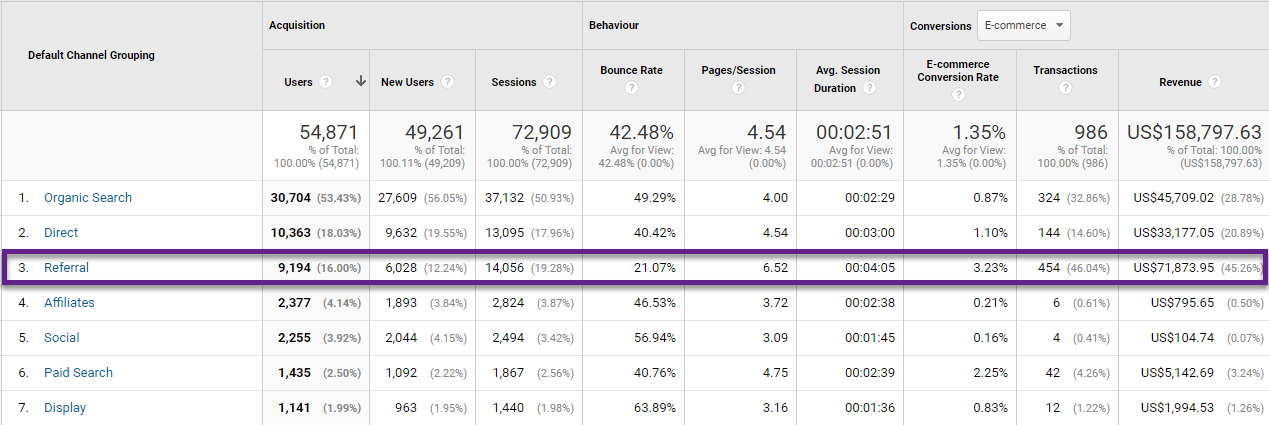
- Referrals have a low bounce rate and relatively high conversion rate.
- High percenrage of traffic from Organic Search -> they don’t invest a lot in other, paid channels.
Focus on E-commerce
On top of the report, click on “E-commerce”:

And now you can see a stronger focus on Ecommerce metrics.

- Referrals are responsible for 16% of all users.
- And bring in 45% of all revenue.
This is when I want to further drill-down on referrals.
Tip: create a custom report to get the metrics and dimensions you need to analyze all data within one overview.
Drill-Down on Data Set
The most easy way to drill-down on one dimension value is by clicking on it (example for Referral).

- Two referrals, mail.googleplex.com and sites.google.com, are responsible for over 95% of all revenue.
- Google might want to reconsider their Channel Grouping as they could decide to group a few referrals into a different group.
This is the top referral (redirected site) in their case:
This example just illustrates how important it is to drill-down on your data so that you can find out what’s really going on.
Segmentation Analysis
The real power of segmentation goes far beyond simple drilling down on your data (which is a good first step).
I have written many posts on segmentation as it is one of my favourite topics.
Here is a basic example to get you started.
Step 1: formulate a business question that you want to answer.
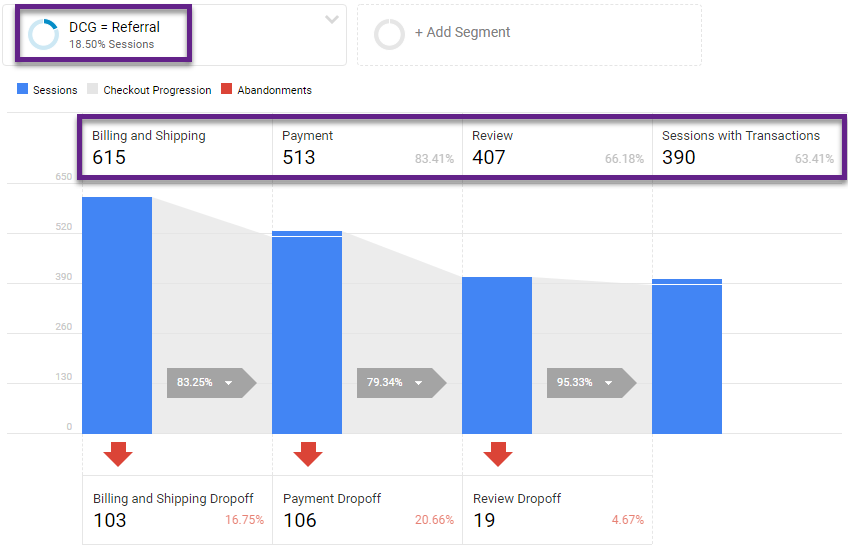
“Does referral traffic behave differently in the checkout funnel compared to non-referral site visitors?”
(it’s just a simple question for demonstrative purposes)
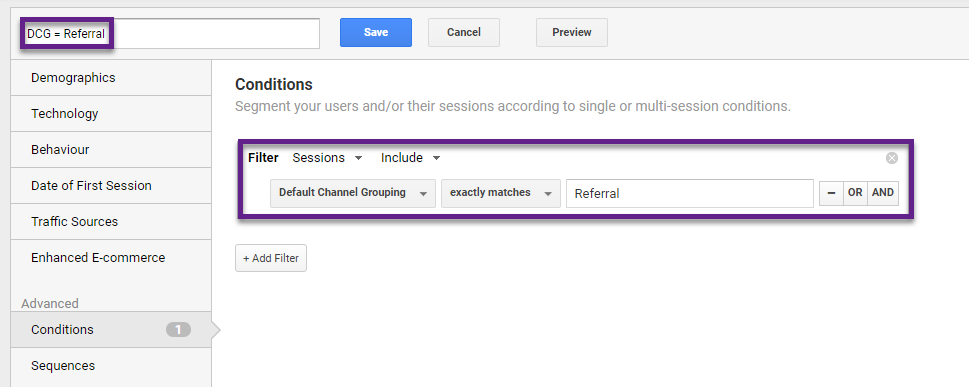
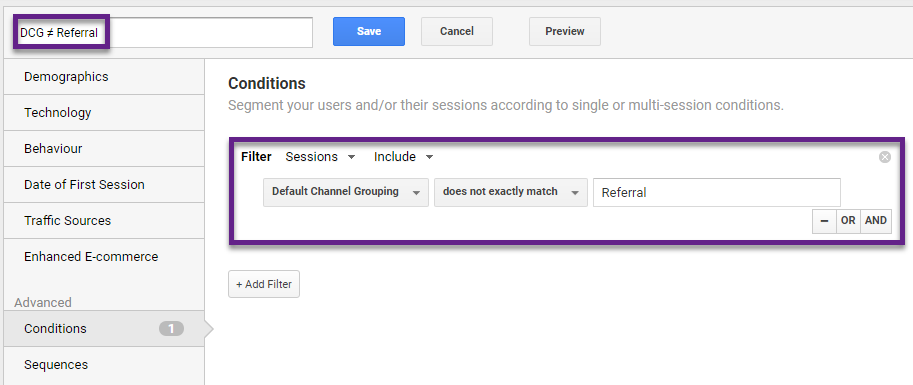
Step 2: set up segment(s) to answer question.
DCG = Referral
DCG ≠ Referral
Step 3: apply segments to “checkout behaviour” report (one segment at a time in this case).
DCG = Referral
DCG ≠ Referral
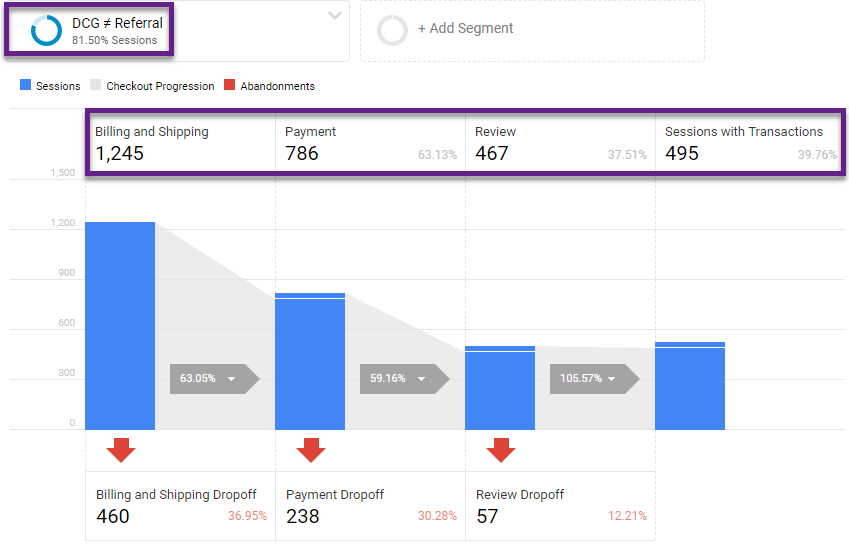
Step 4: analyze your data sets.
In short, referral visitors are much more determined to purchase (high flow through rates and CR%) compared to non-referral visitors.
This is to be expected based on what we discussed before (a lot of them are Googlers).
I hope this example shows how powerful segments in Google Analytics are.
You can apply segments to 90%+ of all reports in Google Analytics and get a much better understanding of what is really going on and where optimization opportunities are hidden.
API and Dashboarding
The Dimensions & Metrics Explorer is a very handy tool as you can learn a lot about API and UI names there.
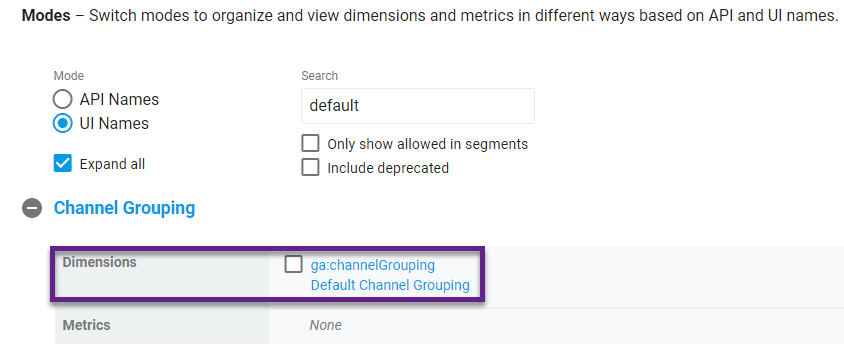 The API name ga:channelGrouping links to the Default Channel Grouping dimension (there is only one dimension and nothing related to Custom Channel Groupings).
And this is exactly why I recommend modifying the Default Channel Grouping to your unique needs.
You might want to build dashboards in Google Data Studio, Klipfolio or via Google Sheets. Also, when you analyze data (e.g. in Google Sheets) it is very powerful to work with this particular dimension.
If you haven’t yet, check out this Google Analytics Audit blogpost and download my free tool. It’s built via the API and Google Sheets and most people are amazed to find out how much needs to be improved.
Concluding Thoughts
In this blogpost I have shared the importance of the Default Channel Grouping dimension and Channels report in Google Analytics.
The Source/Medium dimension can easily get scattered whole over the place (I have seen it more than once :-)). Make sure to aggregate your Sources/Mediums in a logical, understandable channels structure. This will help to better optimize on the channels that are driving traffic (and hopefully conversions) to your site.
As mentioned, I recommend not to modify the Default Channel Grouping on day one (if you are not experienced).
Experiment with the Custom Channel Grouping and make modifications to the Default Channel Grouping in a Test View first. You can always replicate the setup later on.
The Default Channel Grouping is very powerful, but changes/mistakes cannot be undone and your historical data is forever impacted. But don’t be scared, educate yourself and get the most out of this crucial Google Analytics feature.
This is it from my side. Do you already work with the Default Channel Grouping and in what way? Looking forward to hear your thoughts or questions!
One last thing... Make sure to get my automated Google Analytics 4 Audit Tool. It contains 30 key health checks on the GA4 Setup.
I understand rationale behind ” don’t define goal values on reporting views where you enable Enhanced Ecommerce. This will skew your value metrics in GA.” but I think is good to have the entire picture view… May be on other additional view.
Yes, absolutely true. You can setup another view where you don’t enable EE and define values for your goals.
This will skew your value metrics in GA.” but I think is good to have the entire picture view… May be on other additional view.
https://vtrender.com/
Yes, you can set up an additional view where you capture value metrics in aggregate. But in terms of optimization, it is often useful to split between ecommerce and goal values on the view level.
I try to setup a custom alert with the condition that (Other) traffic spikes by x% compared to previous day. Helps catch any incorrect utm tagging quickly.
Hi Adil,
Yes, that’s smart to do! Read this post (https://online-metrics.com/custom-alerts/) for more information.
Best,
Paul
Great post, Paul. In creation of custom channel groupings, specifically breaking out Paid Search into Generic vs Brand, have you ever defined rules around the campaign UTM (i.e. contains “brand”) or medium UTM (i.e. contains “brandsearch”)? Assumptions would no other channels have campaign containing “brand” and UTM tagging/tracking is consistent with no rule overlap. The medium UTM rule would account for platforms (Yahoo) where auto-tagging is not an option.
It seems many articles (including Google) reference leveraging the Manage Brand Terms function to accomplish this, but I see potential gaps in this approach as it relies on the end-user to enter brand terms. What is your perspective on how to best break out Generic vs Brand Paid Search and is the above a suitable work around?
Hi Zack,
Great comment – actually I have always relied on the “Manage Brand Terms” function for getting this done.
And I do believe that you could definitely work with another definition here. However, it is hard to give a common advice as it totally depends on how a website and the campaigns etc. are structured.
I have one query that if i check event data for particular click that time i am getting less no than the adding default channel group as secondary dimension.
Event Action Default Channel Grouping Total Events 1,428
Event Action Total Events 1,058
why this difference is coming?
It could be the result of sampling. Not sure about other reason here.
Thanks for your response
Are we getting aggregated data in default channel grouping?
Is this the reason that i am getting more no ?
Yes, that could be the case and sampling might be involved here.
Hi Paul,
Great, article. I have a question related to using the Default Channel Grouping in reporting through the Google Api.
When using a graph in Data Studio to display conversions per Default Channel, it gives me a higher amount of conversions, than when looking at the same channel during the same week in GA360. For example:
Data studio report – Email: 68 conversions
GA360 – Email: 53 conversions
Even stranger, when I adjust the date period in the data studio report, the number of conversions per channels changes as well for each week. For example, when I look back a full year, the above number of 68 conversions changes to 79 conversions.
What could be the reason for this?
Hi Robbert,
Thanks for the heads up!
Could it be that sampling is applied in Google Data Studio?
Also see: https://www.seerinteractive.com/blog/google-data-studio-sampling/
Best,
Paul
Hi Paul,
Thanks for your quick reply. You are right, the ‘issue’ appears to be caused by sampling.
Any additional quick tips or articles you can share on how to limit the sampling?
Cheers,
Robbert
Hi Robbert,
This article will be helpful:
https://supermetrics.com/blog/google-analytics-sampling-data-studio
Wrote it a couple of years ago, should still work!
Best,
Paul
Paul can you tell me the difference between configuring channels in channel groupings under channel settings in the admin menu of GA360 and custom channel groupings BETA (which appears further down in the menu list)
Hi Indy,
Please have a look at this article and you will exactly know the differences:
https://online-metrics.com/custom-channel-groupings/
Best,
Paul
Hi Paul,
I have a question regarding channel groupings. If a single user has multiple sessions falling into more than one channel grouping, how is this reported in the “Users” column in the channel grouping report?
Thank you for your help.
Hi Jamie,
Good question.
Often, the number of users in each channel adds up to a larger number than the total number of users because some users use multiple channels. The percentage given for each channel refers to the percentage of the total of all channels. New users and sessions are unique values and so are not repeated across channels. A user can only be counted as new once.
Hope this helps!
Best,
Paul