Landing pages have a huge impact on the conversion rate of your website. After reading this post you will know a lot more about how to optimize landing page performance.
The number of different doorways into your website highly depends on the amount of qualitative content on your website.
Brian Dean of Backlinko has shown that creating just a few highly valuable and sharable articles can already do wonders.
Let’s stick with this overall assumption:
Creating a good volume of valuable content on a consistent basis, leads to a growing number of people entering your website via different doorways.
In this article I will feature my “Marathon Running” blog which I created back in 2010.

And I will discuss three primary topics in relation to landing page effectiveness:
- Reach
- Engagement
- Conversion
1. Reach
The first thing you want to evaluate is how popular each of your landing pages is.
Two examples:
- You run an e-commerce site with a page that converts at 80%, but only had five entries in the last three months.
- You run a blog with a page that converts at 100%, but only had one entry in the last month.
Of course, those conversion rates are great and it might indicate an effective longtail strategy.
However, if you only have 50 pages with low volume, this won’t make you rich.
I recommend to first take a look at actual entry page (session) volumes in Google Analytics:
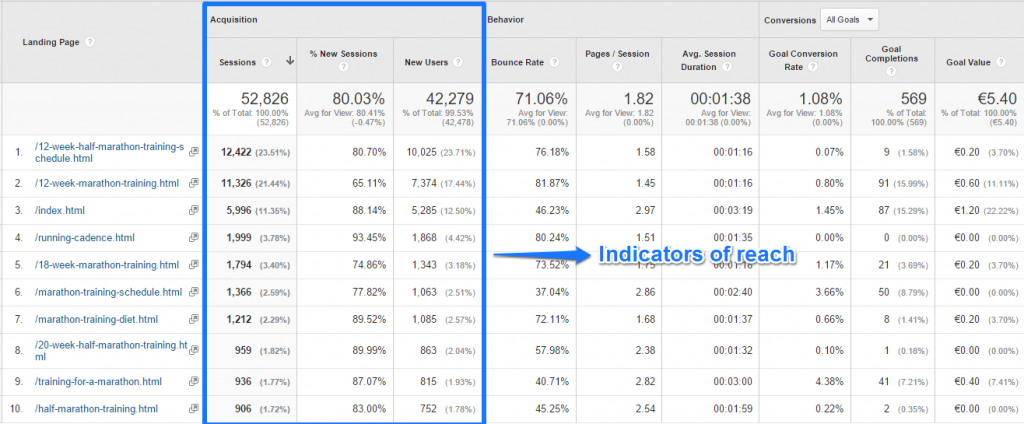 At a glance I can draw a few conclusions here:
- Two of my landing pages (in total there are more than 150 pages) receive 45% of all traffic.
- Top 10 of my landing pages account for 70% of all traffic.
- Above average percentage of new sessions.
- The “12 week marathon training schedule” page receives quite a few returning visitors.
- If my top two pages drop in rankings, I will experience a huge decline in traffic.
- I need to come up with effective strategies to monetize my top performers first.
As you can see, just a few numbers reveal quite a lot about what’s going on.
You have to keep in mind the type of website you are dealing with.
In this case my website receives 80 -90% organic traffic.
In other words, reach highly depends here on search engine rankings.
Ecommerce Shop
A different example, you are just starting out with an e-commerce shop.
A relatively young website doesn’t receive a lot of organic traffic in most cases.
To test your product assortment and prices, you decide to run a PPC campaign.
With a PPC campaign you can partly manipulate which pages receive a lot of traffic and which don’t.
Conclusion: Reach is a good first measure of (landing) page performance, but take into account which channels are sending traffic to your website.
2. Engagement
As a second indicator of landing page effectiveness I like to discuss engagement.
In this context, let’s divide it in two things:
- How do many website visitors react after landing on my website?
- How long do they actually stay on my website?
These two questions and answers to them give a good indication of the actual engagement of your website visitors.
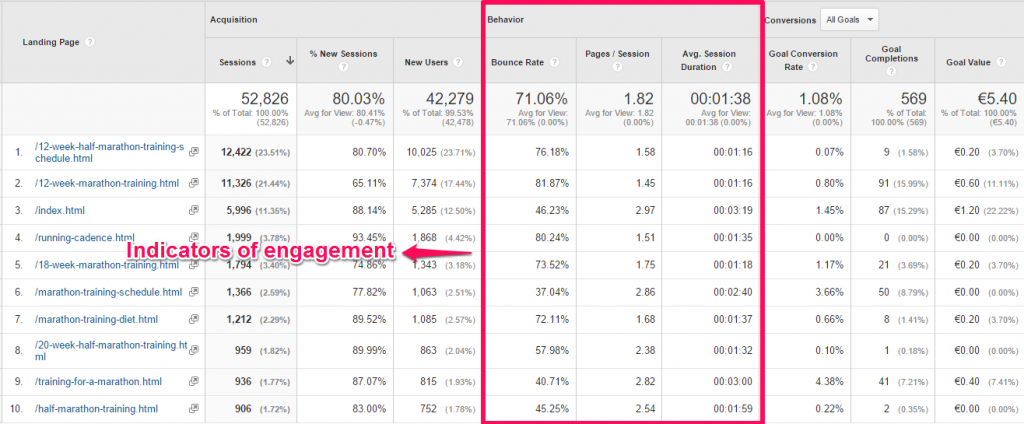
We have three indicators here:
- Bounce rate: “they came, they puked, they left”.
- Pages / session: how many pages did they actually see?
- Avg Session Duration: how long did people stay on my website?
My first thoughts are shown below:
- Average bounce rate of 70%, WOW, that’s high? But wait, it’s a blog and people are searching for a specific topic.
- Pages / session is below two, could be better. However, there are huge differences between pages. Pages that are higher in the website structure (tier 2 pages) “feed” a lot of longtail keyword pages (tier 3).
- Average session duration is higher for tier 2 (longer) pages than tier 3 (shorter) pages.
As you can see, you always need to interpret your numbers in context.
- At what kind of page am I actually looking at?
- Which traffic sources drive the most traffic to this page?
- Is it a short or long page?
- Does the page contain many internal links so that people have many navigational options?
- Yeah right, average bounce rate percentage, but what about the distribution?
You really need to think about segmentation in Google Analytics when you interpret these numbers.
I will show you an example.
On my website /index.html is the actual homepage.
I know the average pageview number of people that land here is around three.
In a couple of steps you can get a more accurate view (distribution of numbers).
Step 1: set up a segment for people that land on homepage.
 Step 2: navigate to Audience >> Behavior >> Engagement >> Page Depth report.
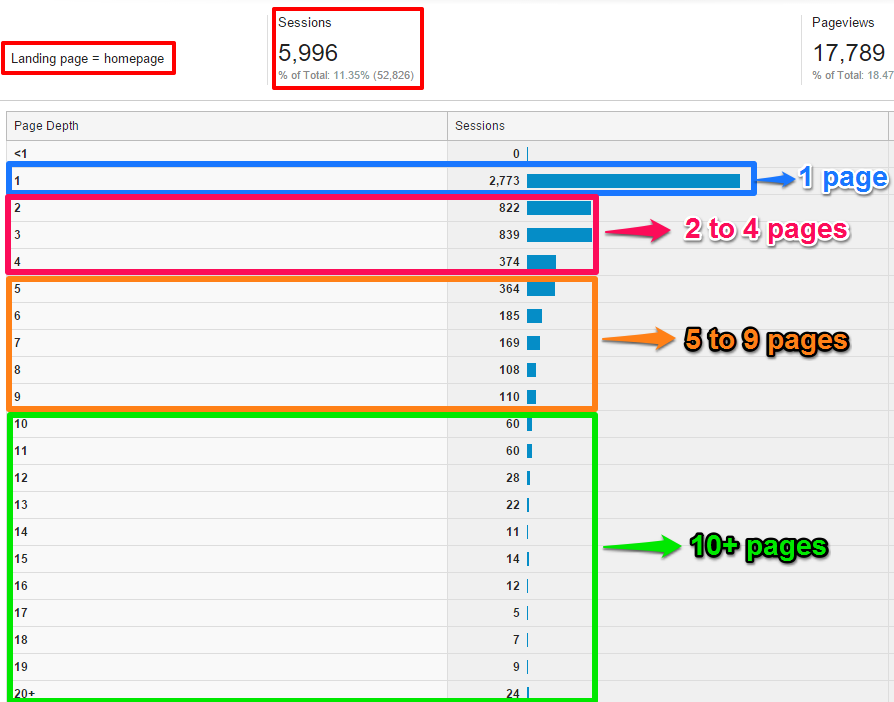 Well, a different story right! This says a lot more than just one plain, average number.
Step 3: make a distribution graph in Excel.
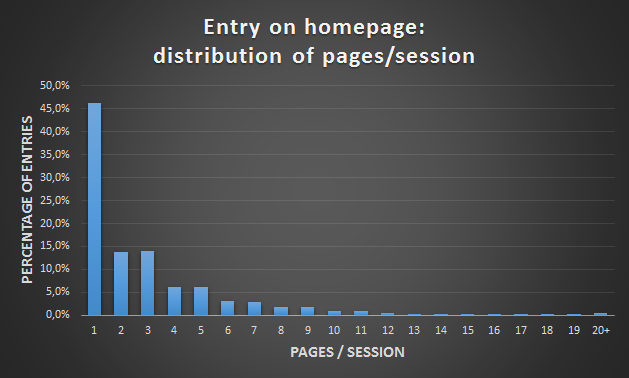
You can see at a glance that more than 45% of all sessions consist of one pageview. You can check it in the earlier table (bounce rate = 46,23%).
Note: these numbers might deviate if you have interactive events set up on the homepage.
Adjusting your bounce rate for time spent on page might be appealing to you. Read this post if you want to learn more.
On this website I have implemented adjusted bounce rate. It brings a lot of additional insights on how my content performs!
3. Conversion
Last but not least, conversion.
In a default landing page report in Google Analytics, you can review goal or ecommerce metrics in the last tab:
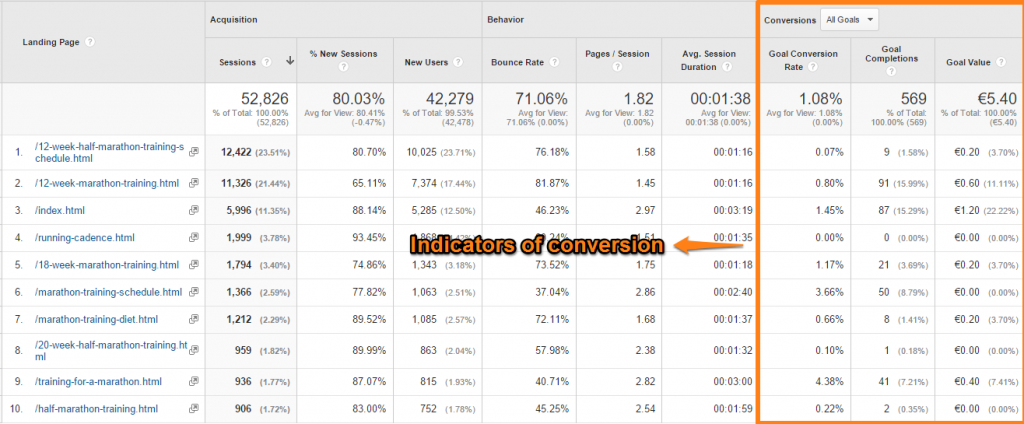 What do we see here:
- Overall goal conversion rate of approximately 1%.
- A few top performers in the top 10.
- Large deviations in conversion rate between pages.
- Four pages are good for almost 50% of my conversions.
It seems that the performance of this marathon website (both in terms of reach and conversions) depends on a few key pages.
This is a risk if one or more of these pages experience a decline in rankings.
In order to fully understand the conversion part in relation to landing pages:
- You need to drill down on specific goals or ecommerce metrics.
- Segment your data in relation to traffic sources.
- Look at both relative as well as absolute numbers.
- Understand how conversion-driven individual pages are built.
- Review the doorway links and call-to-actions on each page.
Last Thoughts
The way I see it, is that you need to learn to tell a story with data.
Daniel Waisberg has created a useful video I recommend you to watch:
I promise you that your insights and results will tremendously grow if you approach your Google Analytics data in a similar way.
In terms of optimization – and as an easy approach -, I recommend to optimize your highest traffic landing pages first.
If their conversion rate is at a sufficient level, start with the next few pages.
Well, this is it from my side. I hope you have enjoyed reading this case study.
One last thing... Make sure to get my automated Google Analytics 4 Audit Tool. It contains 30 key health checks on the GA4 Setup.
Hi Paul! Thanks for putting this blog together =) A quick question for you here.
You mentioned this – “Above average percentage of new sessions.”
Why is new session important here? Correct me if I’m wrong, but I thought that new session is not a good metric to go by as it does not equate to new visitors and the way new session is measured.
K
Hi Kate,
Thank you for your comment and I am glad you like this post!
“New sessions” is a bit confusing indeed.
It’s an estimate of the percentage of first-time visits. Or “sessions that are of a new user”. If you’re a Returning Visitor coming for your second session, in plain english, this might be another “new” session, but in GA, it’s not. So by definition, returning users will not have new sessions.
I have used it to illustrate that my blog has a high reach. A higher number of new sessions means you attract a lot of “new” people to the side. However, the downside is – if this percentage is very high – than just a small percentage of visitors are coming back.
Hope this clears up your confusion,
Paul