Do you already leverage the power of calculated metrics in your Google Analytics setup? This post provides all the information you need to turn this amazing feature into insights!
A few years ago I was quite frustrated about calculated metrics as they were available in Adobe Analytics for ages, but not yet in Google Analytics.
Now you can leverage them for your business in Google Analytics as well and I highly recommend you doing so!
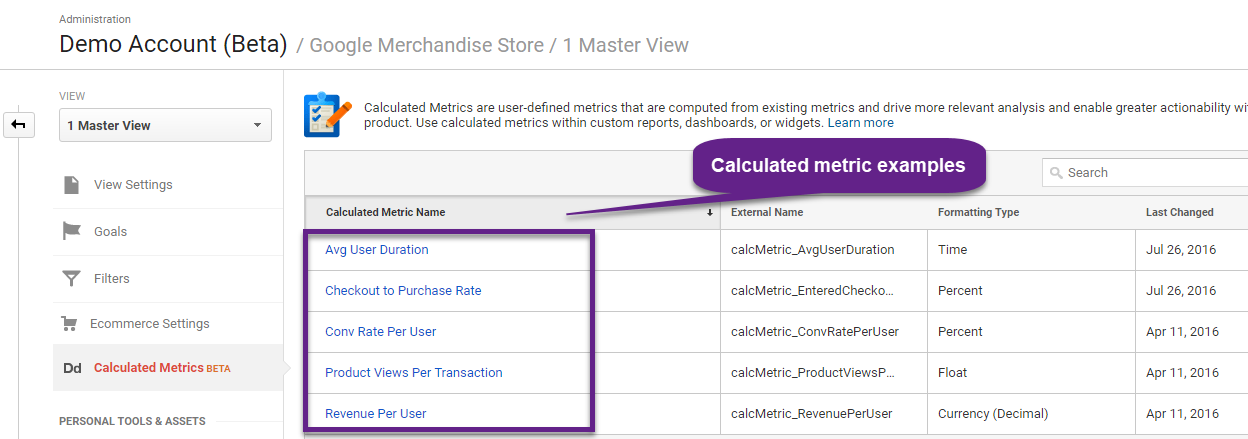
In this post I explain all about calculated metrics in Google Analytics. I will include a list of examples later on to inspire you to set up unique metrics that fit your business best.
Table of Contents
- Google Analytics Metric Types
- Attributes of a Calculated Metric
- Cheating with Calculated Metrics
- Brainstorming Calculated Metrics
- Setting up Calculated Metrics
- Four Ways of Using Them
- 20 Great Examples
- Concluding Thoughts
Google Analytic Metric Types
In one my earlier posts I have explained about the differences between metrics and dimensions.
A quick recap:
- “A metric is an individual element of a dimension which can be measured as a sum or ratio —> a metric measures data.”
- “A dimension is a characteristic of an object that can be given different values —> a dimension describes data.”
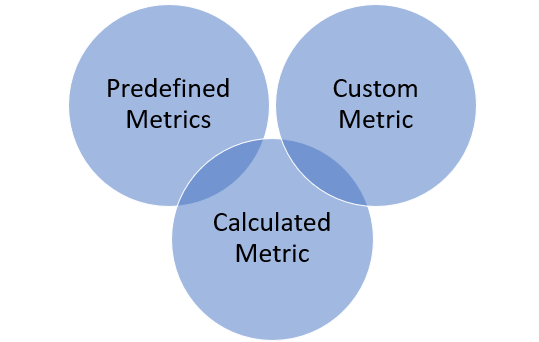 There are three different metric types in Google Analytics:
- Normal / predefined metrics.
- Custom metrics.
- Calculated metrics.
In the following section I will elaborate on each of them.
1. Predefined Metrics
Google Analytics comes with more than 100 predefined metrics and dimensions.
Use the Dimensions & Metrics Explorer to:
- Explore all dimensions and metrics that are readily available.
- Find out which are valid metric-dimension combinations.
- Learn about the differences between API and UI names.
Predefined metrics are available in the standard and custom reports in Google Analytics. Further, you can query them via the Google Analytics API.
Common predefined metrics are:
- Sessions
- Pageviews
- Bounce rate
- Goal completions
- Conversion rate (session-level)
They are a great start, but your business needs and KPIs might vary. That’s when you want to look into custom metrics and calculated metrics.
2. Custom Metrics
Custom metrics are really powerful as they are used to collect data that Google Analytics doesn’t automatically store (in predefined metrics).
It is one of those underused Google Analytics features.
I won’t go into much detail as this post is primarily focused on calculated metrics. Five things to remember:
- Custom metrics are user defined and require both an implementation and configuration action to get them to work.
- A custom metric is configured at the property level.
- You are limited to 20 custom metrics per property (200 for GA 360).
- They are used to collect data that is not automatically collected by Google Analytics.
- Custom metrics don’t work retroactively. Only after a successful implementation and configuration new custom metric data is collected.
Quick tip: track your most important events as/with a custom metric. By doing this you can better analyze and optimize on specific combinations of an event/custom metric and dimension (e.g. traffic source).
3. Calculated Metrics
The third type of metrics are calculated metrics: the main topic of this post.
- They are user defined and require you to modify the Google Analytics configuration.
- A calculated metric is configured at the view level.
- You are limited to 5 calculated metrics per view (50 for GA 360).
- They work retroactively (on your historical data).
- They are very useful to define specific metrics that are more close to the heart of your business (business objectives and KPIs).
By now you know about the fundamental differences between the metrics available in Google Analytics.
You will find out that calculated metrics are really powerful and help you to move from a session to a more user-based view of your data.
In the rest of the post I will go in more depth explaining them. Later on, I will share a ton of actionable examples.
Attributes of a Calculated Metric
A calculated metric has four different attributes:
- Name
- External Name
- Formatting Type
- Formula
They are configured at the view level in the admin section of your Google Analytics account:
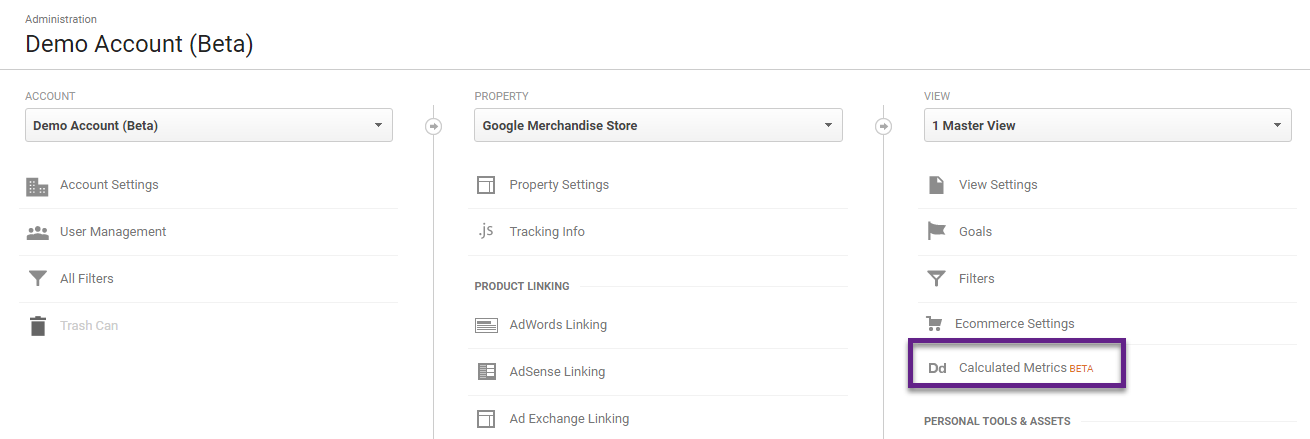 Here is an example:
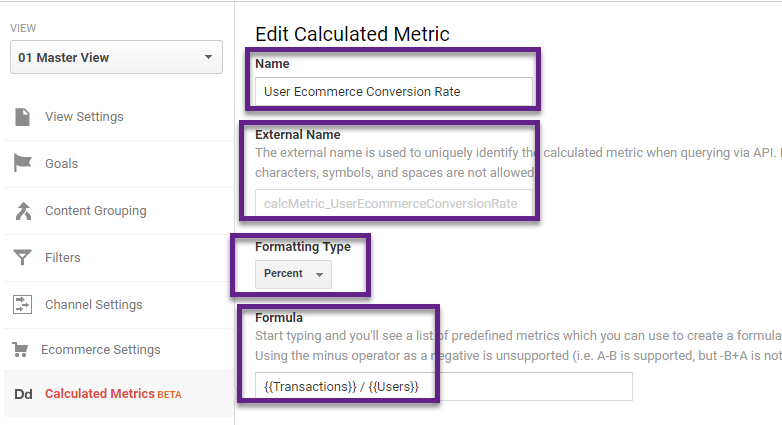
Name
- This is the “web view name” of the calculated metric and how you recognize it in the UI interface.
- Make sure to fill in a descriptive name. In this case – User Ecommerce Conversion Rate – directly reveals what this metric is all about.
You can change the Name whenever you want and its outcome is applied retroactively.
External Name
- This is the “API name” of the calculated metric.
- In order to access a calculated metric via the API, all constituent metrics must also be available by the API.
You cannot change the External Name after the calculated metric is stored in Google Analytics. Best practice would be to delete the calculated metric and set up a new one.
Formatting Type
- You can choose between Float, Integer, Currency (Decimal), Time and Percent when formatting calculated metrics.
- Float: refers to a floating number (can only be positive in GA). Examples include 2.02, .54, 10.11, 9.1.
- Integer: an integer is a whole number, e.g. 1, 2, 4. (can only be positive in GA).
- Currency: currency is the combination of a currency symbol and a floating number.
- Time: a setting in hours, minutes and seconds format. E.g. 11:15:20.
- Percentage: formats a calculated metric as a percentage, e.g. 18%.
You can change the Formatting Type whenever you want and its outcome is applied retroactively.
Formula
Just start typing and you’ll see a list of predefined metrics which you can use to create a formula.
Accepted operators include:
- Plus (+)
- Minus (-)
- Divided by (/)
- Multiplied by (*)
- Parenthesis
- Positive cardinal numbers (0-9), can include decimals
Further, using the minus operator as a negative is unsupported (i.e. A-B is supported, but -B+A is not). You probably won’t need that many characters, but formulas are limited to 1024 characters.
Last notes:
- You can create these metrics based on custom metrics.
- You can create them based on predefined Google Analytics goals.
- You cannot create them based on other calculated metrics.
You can change the Formula whenever you want and its outcome is applied retroactively.
Cheating with Calculated Metrics
As I shortly addressed before, you are limited in the number of calculated metrics you can create.
- Create up to five calculated metrics per view (in free version of GA).
- Create up to 50 calculated metrics per view (in GA 360).
What if you have different needs and want to create more calculated metrics for your business?
I assume that most of you are on the free version of Google Analytics.
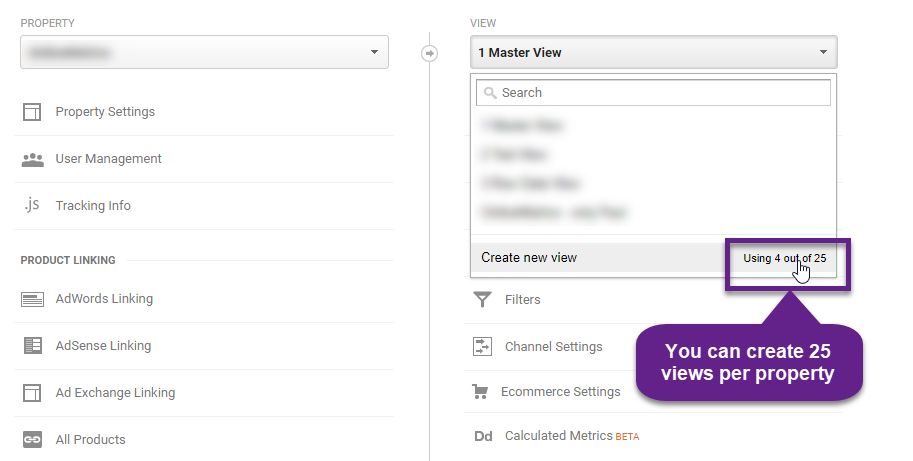
You could create up to 125 (25 x 5) calculated metrics in a Google Analytics property. That’s huge and will more than satisfy your measurement needs.
If you want to keep a master, raw data and test view (the three basic views in each setup), you can still get 115 different calculated metrics in one property.
Main takeaway is that you are not limited to setting up five calculated metrics in a property.
How to Get More Calculated Metrics
- Set up your master view with five calculated metrics.
- Copy the master view with all relevant settings and filters.
- Rename the new view and set up your second set of calculated metrics.
- Repeat step 1 to 3 until you have set up all calculated metrics you need.
Calculated metrics and not copied when you copy your view.
Brainstorming Calculated Metrics
I highly recommend brainstorming with your team before seting up any calculated metrics in Google Analytics.
It might sound contradictory to what I said earlier, but please note that you don’t want to create extra views just for the sake of it. Calculated metrics should be highly relevant for your business.
The main problem with the predefined metrics is that they don’t always reflect your most important metrics. Calculated metrics can provide more depth to your business and how it performs.
- Brainstorm with your team about possible, relevant calculated metrics.
- Come up with a definitive list and measurement plan around your calculated metrics.
- Configure them in Google Analytics.
- Test in the GA interface and find out whether they work as expected.
- Make sure to repeat this procedure at least every year and maybe even every quarter – your business is evolving and so are your needs.
Setting Up Calculated Metrics
Here are five quick action steps for setting up calculated metrics in Google Analytics.
Step 1: brainstorm your calculated metric.
Step 2: log in to Google Analytics and navigate to the relevant view.
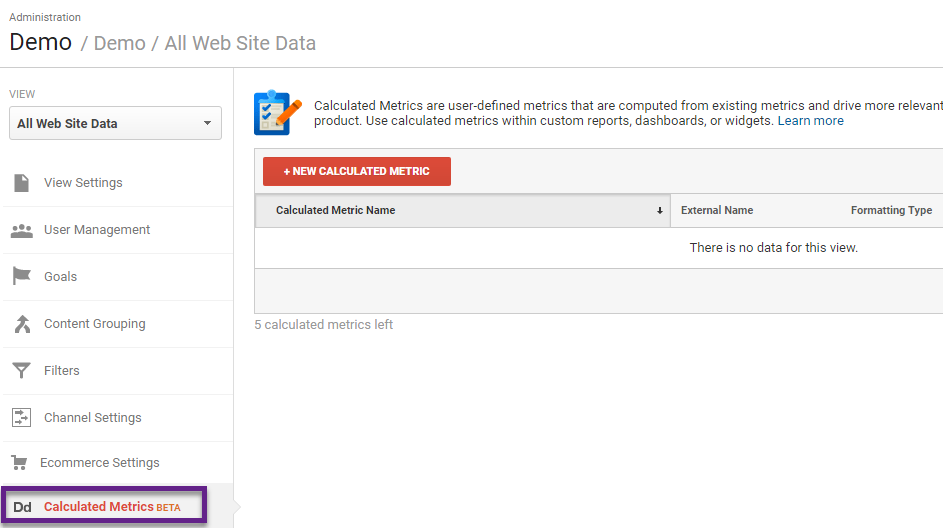
Step 3: click on “+ New Calculated Metric” button.
Step 4: fill in all details of the calculated metric.
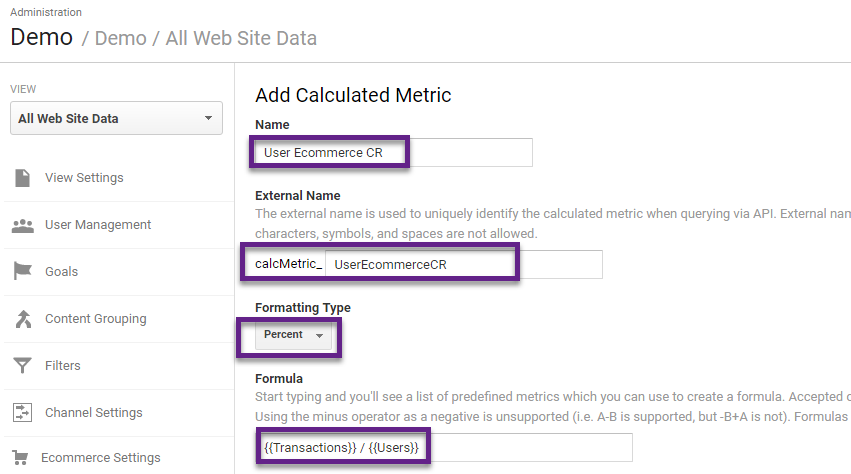 Step 5: in the same screen – click on “create – and you are done.
Note: you can copy or delete any calculated metric that you have created in the active view.
Four Ways of Using Them
You can use calculated metrics in multiple ways:
- Custom Report
- Dashboard
- Google Analytics API (indirectly)
- Google Data Studio
1. Custom Report
You are allowed to add any metric to a custom report in Google Analytics.
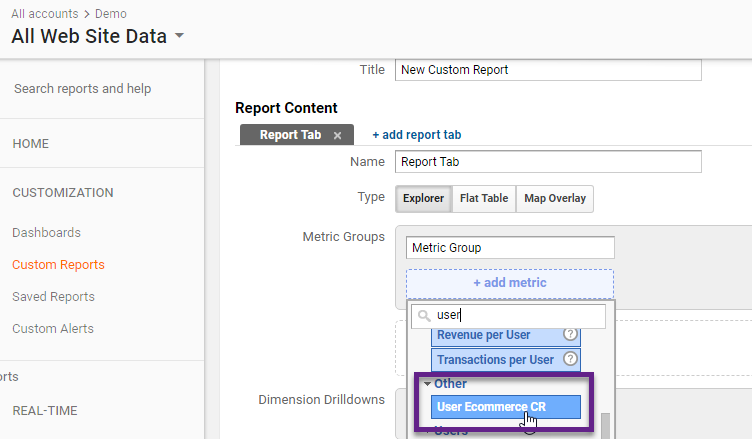
Calculated metrics are grouped in the category “Other” and can be easily added to a custom report:
2. Dashboard
I have never been a huge fan of the Google Analytics dashboards (choose Data Studio instead)!
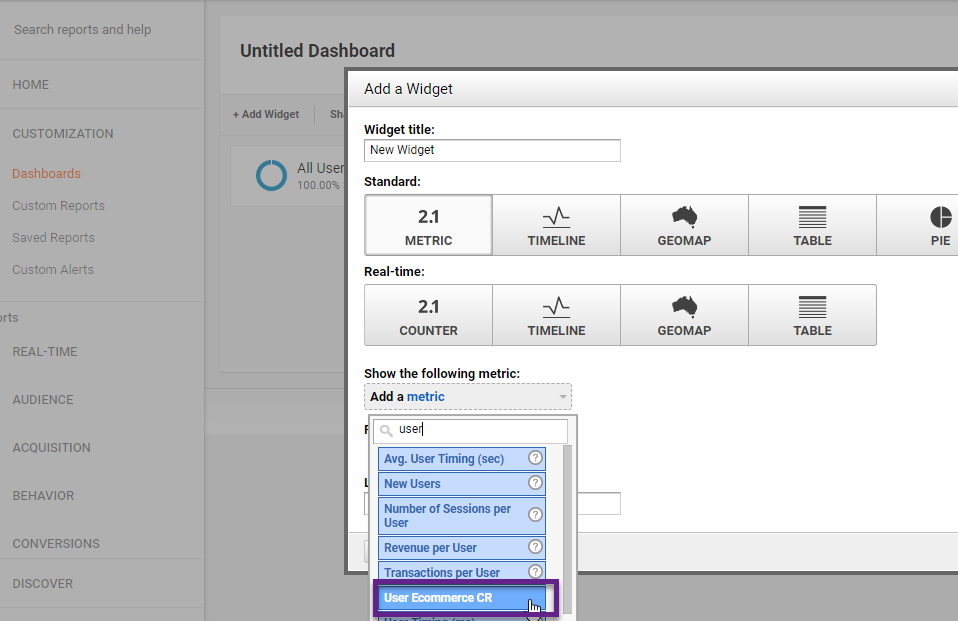
But, here you can see you can add calculated metrics in just a few seconds:
3. API
As mentioned before, you can’t directly query a calculated metric via the Google Analytics API.
However, you could query all the metrics that make up the calculated metric separately. And use formulas (e.g. in Google Sheets) to calculate the new metric automatically.
4. Google Data Studio
The great thing is that once you have created a Calculated Metric in Google Analytics you can pull it into Google Data Studio.
In addition, you have the option of creating your own metrics inside Data Studio.
It’s a best practice to create a calculated metric in Google Analytics if you want to access the calculated metric in both Google Analytics and Google Data Studio.
Calculated Metrics Examples
In the last part of this article I will share 20 examples that can provide actionable insights.
Go through them and pick the ones that are most relevant for you and your business. In addition, it might inspire you to come up with other calculated metrics unique to your business – that are even more powerful!
Category of Calculated Metric
Behavior
The first category of calculated metrics consists of behavioral metrics.
1. Pageviews / User
Pageviews per session is a predefined metric in Google Analytics.
I love to set up an additional calculated metric to get additional insights on user behavior.
- Name: Pageviews per User
- Formatting Type: Float
- Formula: {{Pageviews}} / {{Users}}
2. Sessions / User
How often do your website visitors return to your website? This is when the “session per user” metric can be really helpful.
- Name: Sessions per User
- Formatting Type: Float
- Formula: {{Sessions}} / {{Users}}
3. Non-Bounce Rate
The percentage of sessions where people bounce on your website, is predominant in Google Analytics.
Would you like to know the opposite as well? This metric show the percentage of sessions with more than one pageview (of where an interaction event was triggered).
- Name: Non-Bounce Rate
- Formatting Type: Percent
- Formula: ( {{Sessions}} – {{Bounces}} ) / {{Sessions}}
4. Non-Bounces
This is practically the same metric, difference that it is set up as an “integer” instead of “percent”.
- Name: Non-Bounces
- Formatting Type: Integer
- Formula: {{Sessions}} – {{Bounces}}
5. Average User Duration
This is an interesting metric for content-based websites. How long does a user stay on the website?
- Name: Average User Duration
- Formatting Type: Time
- Formula: {{Session Duration}} / {{Users}}
Goal
The second set of calculated metrics consists of goal related metrics.
6. Overall User Goal CR
In most cases I recommend analyzing individual goal conversion rates.
But at certain times – and for overall performance measurements – you want to look at it on an aggregated level.
- Name: Overall User Goal CR
- Formatting Type: Percent
- Formula: {{Goal Completions}} / {{Users}}
7. Individual User Goal CR
This one is almost the same as #6, only difference is that the focus is on an individual goal.
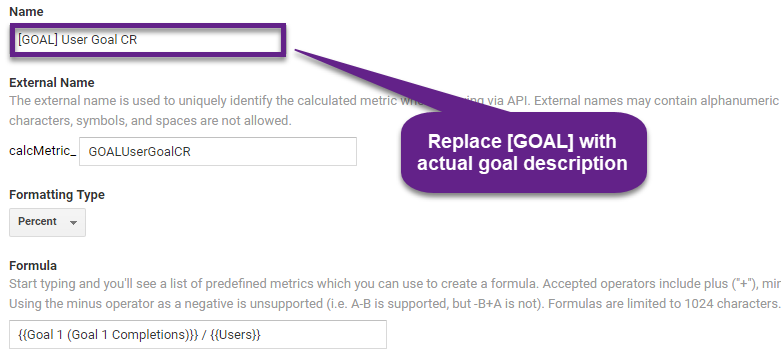
- Name: [NAME OF GOAL] User Goal CR
- Formatting Type: Percent
- Formula: {{Goal 1 (Goal 1 Completions)}} / {{Users}}
8. to 10. Goal Flow Percentages
This calculated metrics set needs a quick introduction.
Back in 2013 I wrote a post on horizontal funnels in Google Analytics. They can be helpful in understanding how – on a dimension level – visitors perform on each step of your funnel.
This is useful for ecommerce sites, booking engines, lead generation sites and many more website types.
Here is how you can leverage the setup via calculated metrics.
- Identify all stages of your funnel.
- Create a goal for each stage of your funnel (you might need to use RegEx).
- Set up calculated metrics; you might need three calculated metrics or even more (consider a separate view to get this done).
Here is an example (check out the Google Analytics Demo Account!)
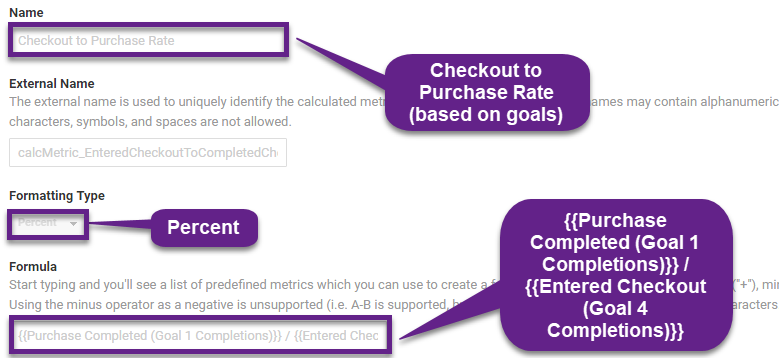
- Name: Checkout to Purchase Rate
- Formatting Type: Percent
- Formula: {{Purchase Completed (Goal 1 Completions)}} / {{Entered Checkout (Goal 4 Completions)}}
11. Event Goal Completions
Event tracking is the most important feature to measure interactions on your website. You can set up a valuable related calculated metric that is related to both events as well as goals.
You can calculate the number of goal completions for website visitors that triggered an event.
- Name: Goal Completions per Event
- Formatting Type: Float
- Formula: {{Goal Completions}} / {{Unique Events}}
12. Event Conversion Rate
This metric can be really handful if you want to find out how custom interactions (measured with events) impact your conversion rate.
- Name: Event Conversion Rate
- Formatting Type: Percent
- Formula: ( {{Goal Completions}} + {{Transactions}} ) / {{Unique Events}}
Keep in mind that setting up a goal for a purchase and measuring this conversion as a goal AND transaction might skew this value.
Ecommerce and Revenue
The last set of calculated metrics are related to ecommerce and/or revenue. Keep in mind that (enhanced) ecommerce and revenue metrics can also be leverage on non-ecommerce websites.
13. Total Value
In one of my previous posts I mentioned about not setting up goal and ecommerce values in the same view. In rare cases this might still be useful. Especially when the goal value refers to something else as the ecommerce transaction.
This metric will help you calculate the total value:
- Name: Total Value
- Formatting: Currency
- Formula: {{Revenue}} + {{Goal Value}}
14. Value per Session
Do you want to know how much value each of your organic sessions bring? Consider implementing this calculated metric:
- Name: Value per Session
- Formatting: Currency
- Formula: ( {{Revenue}} + {{Goal Value}} ) / {{Sessions}}
15. Value per User
You can also measure the value on a user (instead of session) level.
- Name: Value per User
- Formatting: Currency
- Formula: ( {{Revenue}} + {{Goal Value}} ) / {{Users}}
16. Transactions per User
The next calculated metric is very helpful to go deeper on the transaction level.
- Name: Transactions per User
- Formatting Type: Float
- Formula: {{Transactions}} / {{Users}}
17. Revenue after Refunds
On default, the revenue in Google Analytics is reported without taking refunds into account.
This metric will exclude refunds from revenue:
- Name: Revenue After Refunds
- Formatting Type: Currency
- Formula: {{Revenue}} – {{Refund Amount}}
18. Average Cost per User
You might run AdWords campaigns or other campaigns that are connected to the data import feature. In this case it is very helpful to know the costs of bringing a website visitor to your website.
- Name: Cost / User
- Formatting: Currency
- Formula: {{Cost}} / {{Users}}
19. Product Views per Transaction
Do most people just see one or two products before converting? Or are they comparing many products on your website?
Use this metric to answer all your questions:
- Name: Product Views / Transaction
- Formatting Type: Float
- Formula: {{Product Detail Views}} / {{Transactions}}
20. Average Order Value (Clean)
On default, the order value in Google Analytics includes both shipping and tax (if applicable). It might be valuable to get a more clean metric where shipping and tax are excluded.
- Name: Average Order Value (Clean)
- Formatting Type: Currency
- Formula: ( {{Revenue}} – {{Shipping}} – {{Tax}} ) / {{Transactions}}
Thanks to Loves Data and Avinash for inspiring me to come up with this final list.
Concluding Thoughts
- Calculated metrics are incredibly powerful to gather additional insights from your Google Analytics data.
- Make sure to closely align them with your online business objectives and KPIs.
- Setting them up is relatively easy, brainstorming which are important for YOU is key.
- You can set up more than five calculated metrics by creating additional views in your property.
- They can be leveraged both in Google Analytics as well as in Google Data Studio.
- In Google Analytics, the most common way of using them is in custom reports.
This is it from my side! Do you already work with calculated metrics and what are your favourite ones? Happy to hear your thoughts!
One last thing... Make sure to get my automated Google Analytics 4 Audit Tool. It contains 30 key health checks on the GA4 Setup.
Hi Paul,
What if we want to add cost of goods data to a custom report in google analytics. Let’s say we have a Google Spreadsheet with two columns: product SKU and Marge in euro’s. What we want to do is everytime a Product SKU is sold to add the cost of goods data of that specific SKU.
So if we have product 1234 which costs €10 to buy for the company and which is sold for €50 to customers. If someone buys this specific product we want to add the €10 to a custom report which show the transaction revenue and cost of good data.
Grt.
Michael
Hi Michael,
Great question! I recommend to read another article on my site:
https://online-metrics.com/gross-profit/
Will be a great help for you to set this up!
Best,
Paul
Hi Paul,
Thanks for your reply, we have already done that. But now we have inflated hit numbers. So on every pageview the custom metric is triggered. Is there any way to change this if we don’t have GTM? Google Analytics is hardcoded on the site.
Grt,
Michael
Hi Michael,
With GTM or another tag management solution it is probably more easy. I think this should be possible even if you hardcode it. Unfortunately I don’t possess the technical knowledge to write this code for you – a technically skilled developer will come in handy here.
Your role would be to specify the issue, the results you are after and let the developer take care of the technical solution / implementation.
Best of luck,
Paul
Thanks for the in depth look into this and the examples! I’m going to review this more closely, but plan on using these in Data Studio first. Should be great for high-level reporting, but of course using them there won’t get you the detail they would give you in
Analytics
Hi Lee,
Great to hear from you!
It’s definitely a great use case apply them in Data Studio, but like you mentioned – if you want to make a detailed analysis – I would use them in Google Analytics and/or replicate them in an external doc (e.g. Google Sheets) via the Google Analytics API. This will bring much more flexibility for your analysis and insights.
Best,
Paul
Hello,
Thanks for the in depth look into this and the examples! I’m going to review this more closely, but plan on using these in Data Studio first. Should be great for high-level reporting, but of course using them there won’t get you the detail they would give you in
Analytics
Thanks
Completely agree Arman. Two things to keep in mind:
– It is a great start to use the examples shared in this post. But make sure to define them specifically aimed for your business.
– Calculated fields in Data Studio can be very useful as well since you can use functions and arguments to make them more sophisticated and useful.
Best,
Paul
Hey, Thanks for these all calculated metrics. But actually, I want to know is it possible to calculate Ad Spend in google analytics?
Hi, Ad Spend from AdWords is directly available if you correctly connect AdWords to Analytics (ga:adCost). However, if you want to calculate total Ad Spend, you would need to use the “import cost data” feature and upload it for all your campaigns. This can both be done manually as well as automatically if you use specific, additional tools.
Hey Paul,
is it maybe possible to implement a pagescore with calculated metrics in GA?
We have our scores we would like to give to every aspect on the site.
E.g. We give 5 points to a contact us button, but now we would like to implement those scores in GA with calculated metrics, so we can create a pagescore.
Thanx in advance!
Sam
Hi Sam,
I believe this is not the smartest way to implement this and it would be rather difficult (maybe even impossible) to set up.
I would go for tracking certain actions with events and linking it to an external doc where you automatically calculate the page scores based on dimensions page and event (category/action/label).
Best,
Paul
Hi Paul,
Thanks for this great list!
I am actually trying to create a calculated metric to calculate the median of sessions or users. Have you made such a metric before? Do you see problems in calculating the median value of sessions? Thanks in advance!
Hi Christelle,
Thanks for the heads up!
Never tried it and unsure what insights you are after?
I believe your best bet is using the Google Analytics API and calculate median values outside of GA (e.g. in a spreadsheet).
Best,
Paul
13. Total Value
“Especially when the goal value refers to something else as the ecommerce transaction.”
Hello Paul, could you give an example for this case? I do not quite understand this kind of “goal value”…
Thank you.
Sure, here is an example.
An agency selling both courses as well as consultancy. Courses can be measured as direct sales (Ecommerce) and consultancy is measured through setting up goals and goal values. E.g. via measuring the effectivity of the leadgen form on your site.
Thank you, Paul! I have read it through. Great examples!
I now have a question.
We want to locate high-buying-intent users by seeing how many goals he fulfills on the website. And then we can make better biddings in retargeting campaigns for these users.
For example, user A hits 8 images, click the review button, hit the live chat. User B just hits 2 images, and scrolls down the page and then leaves the site. Obviously, Users like A are who we would like to invest more in advertising.
Second, different actions may imply intent in different degrees. Compared to just hitting images, people who start a live chat maybe more likely to convert.
We want to give different weight to those kinds of actions.
How can we use calculated metrics to satisfy the above needs? And except for calculated metrics, what else GA features should we use in this case?
Thank you so much!
I would set up something like a “Weighted Goal Conversion Rate”.
Example below:
Name: Weighted Goal Conversion Rate
Formatting: Percent
Formula: (( {{Live Chat (Goal 1 Completions)}} x 6 ) + ( {{Review (Goal 2 Completions)}} x 3 ) + ( {{Product Image (Goal 3 Completions)}} x 1 )) / ( 10 x {{Sessions}})
Calculated Metrics are a great use case (maybe the best) for this. In addition you can analyze (segment on) individual goals and events.
Also, you might want to get your data in a Google spreadsheet for further analysis (e.g. via Supermetrics add-on).
Hope this helps!