A few weeks ago I wrote a post on adjusted bounce rate. I did explain why you should consider changing the default bounce rate calculation. And how to set this up via Google Tag Manager.
In the last month I have analyzed a huge amount of data on my website.
This article contains the most interesting insights and learnings from my adjusted bounce rate case study.
As you can see, my bounce rate values changed dramatically after December 25th 2014.
New Bounce Rate Calculation
Standard bounce rate in Google Analytics:
“Bounce Rate is the percentage of single-page sessions (i.e. sessions in which the person left your site from the entrance page without interacting with the page).”
In this calculation, “time on landing page” is not taken into consideration.
Before the 25th I have done some tests with the following time stamps:
- 30 seconds (if a website visitor spends > 30 seconds on landing page, no bounce)
- 1 minute (if a website visitor spends > 60 seconds on landing page, no bounce)
- 2 minute (if a website visitor spends > 120 seconds on landing page, no bounce)
- 3 minute (if a website visitor spends > 180 seconds on landing page, no bounce)
My bounce rate roughly varied from 15 to 45% with these four time stamps.
I have decided – based on my experiences – to set my adjusted bounce rate at 60 seconds.
My adjusted bounce rate calculation:
“Adjusted Bounce Rate is the percentage of single-page sessions (i.e. sessions in which the person left your site from the entrance page without interacting with the page) with time spent on landing page less than 60 seconds.“
I feel that if you spend 60 seconds or more on my website (first page), you are most probably consuming my content.
Remember to experiment and set a time stamp that fits your unique website and audience in the best way. It doesn’t make sense to simply copy my numbers.
Three Important Lessons
It has been a very interesting experience and I have learned a lot.
That’s why I like to share the most important learnings with you.
A Lower, More Actionable Bounce Rate
If you run a blog like me, you know that your standard bounce rate is relatively high.
Most people consume – especially when landing after a longtail search – the first content page and leave. This is natural. You didn’t choose to buy a book.
In my case, the standard bounce rate varies between 65 and 75%. Compared to other bloggers, this is normal and actually quite good.
However, after implementing my adjusted bounce rate of 60 seconds, my bounce rate is around 20 to 25%!
In other words:
“More than 75% of my website visitors spend at least 60 seconds on the first page or view at least two content pages. I am pretty satisfied with this number. This helps me to judge the quality of my content in a better way.”
Which Content is The Most Sticky
As the title might already imply, I have measured differences in adjusted bounce rate (stickyness) of my blog landing pages.
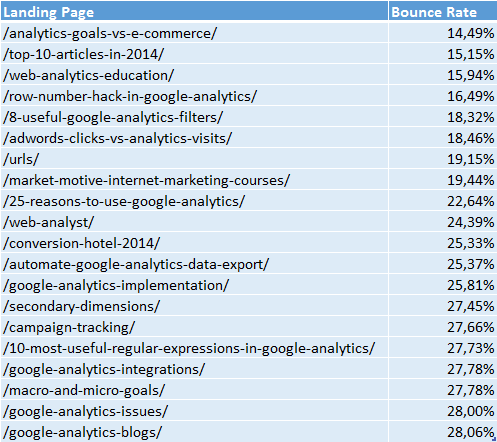
In the overview below you can see some more details:
(top 20 blog posts based on number of sessions and filtered on bounce rate)
The stickyness of the content varies between 14 and 29%. As I collect more and more data, the reliability of the numbers will grow.
“What content do YOU value the most and where should I write about more in the near future?”
Of course I could run a survey and ask this question to my valuable readers like you.
I love to hear your opinion, but this data set is worth a lot as well!
Correlation Between Bounce Rate and Pages per Session
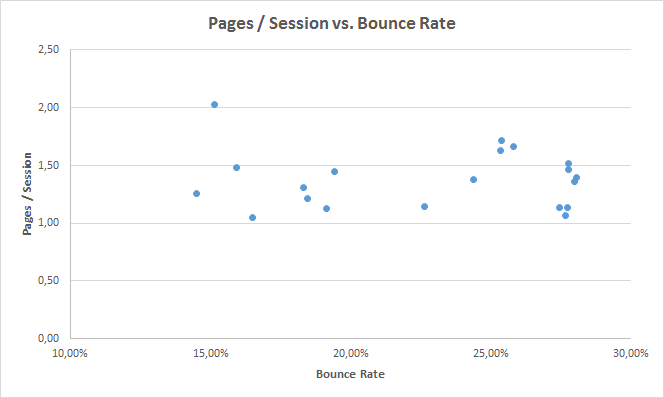
Another thing I discovered is that there is no correlation between bounce rate and pages/session.
I have used a scatter plot (Excel 2013) to visualize any relationship there might be:
There are 20 landing pages in this sample.
I have used the Excel function CORREL to calculate the number.
In my case the correlation coefficient equals -0,05.
Since this number is very low (near 0), it means there is a no (lineair) relationship between adjusted bounce rate and pages/session.
After collecting more data I might analyze this metric again in the near future.
Tip: set up a different GA property first before implementing adjusted bounce rate in your main data view. You can always decide to keep running two trackers on your website.
Not Running a Blog?
You are (not yet) running a blog? It doesn’t matter!
You could answer a ton of questions with this adjusted bounce rate metric. It doesn’t matter in what industry you are working or what type of website you have.
This metric delivers great insights on blogs, ecommerce sites, services sites, lead gen sites…
Really, just give it a try!
I hope my bounce rate case study puts you in the right direction.
Best of luck with your optimization efforts!
One last thing... Make sure to get my automated Google Analytics 4 Audit Tool. It contains 30 key health checks on the GA4 Setup.


Leave a Reply