Reducing your bounce rate is a crucial step in establishing a profitable user journey, both for you and your website visitor. In this in-depth guide I explain all you ever need to know about this very important metric.
I often got asked questions like: “What is a good bounce rate? My bounce rate is 40%…”.
“It depends” is my usual answer.

Personally I don’t like these average bounce rate benchmarks because in general they don’t make a lot of sense.
Do these benchmarks encourage you to take a specific action? No, I don’t think so.
Of course, if you tell me that your average website bounce rate is 75%, I think that’s pretty high! However, if you run a blog, this can be quite normal actually.
Context is key here.
Start with understanding the reasoning behind the bounce rate metric and reduce it on your own website. Don’t look too much at your competition, you are different!
In this guide I will demystify the (Google Analytics) bounce rate metric and how you can best analyze and optimize this metric.
A thorough case study is included as well!
I will start with the basics and cover advanced topics later in this article.
Although I recommend to read the entire article, you can navigate to your favorite topic by using the jumplinks below.
Table of Contents:
- Bounce Rate Definition
- Bounce Rate vs Exit Rate
- Event Tracking and Bounce Rate
- Analyzing Bounce Rate
- Reducing Bounce Rate
- Adjusting Bounce Rate
- Concluding Thoughts
Bounce Rate Definition
“They Came, They Puked, They Left” is how Avinash Kaushik illustrates the bounce rate metric.
Here is an old video (2007) which is still great to watch:
I can only partially agree with the “puking” definiton. :-)
Let me illustrate this with two examples:
- Ecommerce website: if a visitor lands on a product page and immediately leaves your website, it’s a “puker” (in most cases).
- B2B website: if a visitor lands on your stock market page (with daily updates) via a bookmark and immediately leaves your website, I don’t think it’s a “puker”. This person has found the information where she was looking for, task completed!
So once again, context is really key. Your website, goals, specific segment… they all matter! That’s why it is such a complicated metric.
In Google Analytics the bounce rate is defined as:
“The percentage of single-page sessions (i.e. sessions in which the person left your site from the entrance page without interacting with the page).”
In easy words this means:
- The person that visited your website only saw one page (triggered one pageview).
- The person didn’t click on a button, link or triggered another interaction event (will explain more later).
Bounce Rate vs. Exit Rate
Now that you have a pretty good understanding of what the bounce rate is, let’s compare “bounce rate” and “exit rate”.
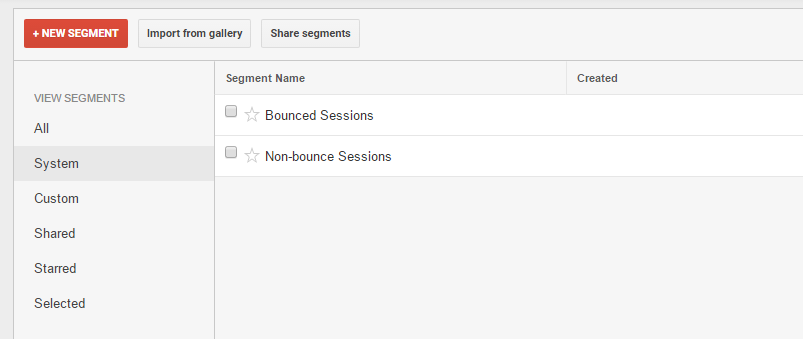
Bounce Rate is measured at the session-level. You can distinguish between bounced and non-bounce sessions. The latter is actually a pretty powerful segment to analyze and one of the default segments in Google Analytics:
Exit Rate is measured on the page-level. It’s the page on which a website visitor leaves your website. A high exit rate is especially bad if it is on one of your funnel pages (e.g. form, cart page or checkout page).
Keep in mind: “A bounce is always connected to an exit, but an exit doesn’t have to be connected to a bounce”.
This is how Google Analytics frames it:
To understand the difference between Exit Rate and Bounce Rate for a particular page, keep the following points in mind:
- For all pageviews to the page, Exit Rate is the percentage that were the last in the session.
- For all sessions that start with the page, Bounce Rate is the percentage that were the only one of the session.
- Bounce Rate for a page is based only on sessions that start with that page.
Practical Example
For demonstration purpose I have build a custom report for an article I wrote earlier about the Google Analytics Demo Account (must read!).

And here are the Bounce Rate and Exit Rate: As you can see the bounce rate is calculated on the session-level this compared to exit rate on the page-level.
Note: a smart analyst might directly say “how the heck can that bounce rate be so low compared to the exit rate?” Well, that’s because I have implemented adjusted bounce rate measurements based on timings. We will discuss that later as well.
Event Tracking and Bounce Rate
Basic pageview tracking is really just the start.
Measuring all sorts of interactions on your website is crucial if you want to get a better understanding of how your visitors behave and which functionality performs well or is lacking.
The most common solution for measuring interactions is “event tracking“.
On the technical side I like to distinguish between four different options:
- Implement event tracking hardcoded on your website on each different element manually (GA hardcoded).
- Implement event tracking hardcoded on your website and use JS functions to capture more elements at the same time (GA hardcoded).
- Implement event tracking via GTM and set this up for each event individually (GTM instead of GA hardcoded).
- Implement event tracking via GTM and build in some automation to capture more interactions at once (GTM instead of GA hardcoded).
My preferred options are number three or four. You are much more flexible and independent if you set up event tracking and other GA measurements via GTM.
It’s outside the scope of this article, but just a quick mention that you can have event tracking partially hardcoded and partially set up via GTM. It just depends on your current situation and what the “costs” are of a possible migration.
Non-Interaction vs. Interaction Events
The reason why I brought this up here is that your bounce rate is influenced by how you track the events.
You have two choices:
- Non-interaction event (no influence on bounce rate measurements).
- Interaction event (influence on bounce rate measurements).
You have to decide whether you want an interaction to influence your bounce rate or not. There are some best practices but at the end it is completely up to you. And how you want to work with your data.
Some people like to measure a click to an external website as a non-interaction event and others measure it is an interaction event. And there is also a group that decides upon the actual outbound link involved.
In general, make sure to use non-interaction event tracking if you set it up for events that are easily and often triggered:
- Scroll tracking
- Hover tracking
- Timing events (unless you want to influence/adjust your bounce rate)
On the other hand, important actions/clicks on your website like download buttons, clicks to cart pop ups etc. should be measured as an interaction event. They are very often directly or indirectly tied to your bottom line.
Google Analytics hardcoded
Here is a quick example on how to implement event tracking hardcoded on your website.
Don’t forget to add nonInteraction: true to your event tracking scripts:
ga(‘send’, ‘event’, ‘Videos’, ‘play’, ‘Fall Campaign’, {
nonInteraction: true
});
This is really a must if you don’t want to skew your numbers.
Google Tag Manager
Here is an example in Google Tag Manager:
![]()
- Non-Interaction Hit set to false means that the interaction will influence the bounce rate.
- Non-Interaction Hit set to true means that the interaction won’t influence the bounce rate.
This can be quite confusing at first, but make sure to get this right in your implementation!
Analyzing Bounce Rate
By now you should understand how the bounce rate is calculated on default. In addition you can explain the difference between bounce rate and exit rate.
The next question is, how to best analyze the bounce rate numbers of your site?
A few months ago I explained about the Google Analytics configuration in the Google Analytics Demo Account.
In this blogpost I use the same account as a case study. Thereby I focus on the numbers of Q3 2016.
Disclaimer: I assume that the account implementation and configuration are done correctly so that we can trust the numbers.
1. Overall Bounce Rate Metric
Navigate to Audience >> Overview.
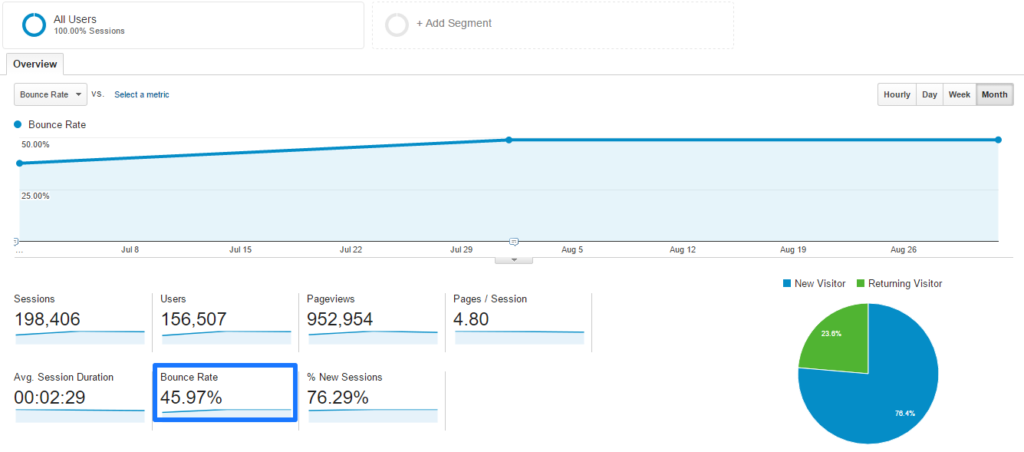 The average bounce rate of the Google Merchandise Store is around 46%. Further we can see a slight increase over the last few months.
Unfortunately this doesn’t reveal any actionable information we can use to reduce the bounce rate and optimize the website outcome. In other words, we need to dig deeper.
2. Bouncers vs. Non-Bouncers
Applying Google Analytics segments is one of the most powerful ways to get a better understanding of bouncers vs. non-bouncers:
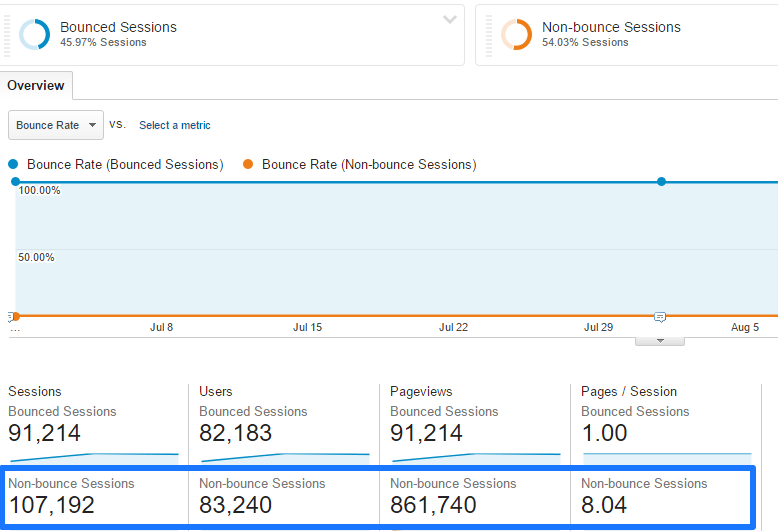
I have switched the All Users segment to Bounced Sessions and Non-bounce sessions. Both of these segments are system segments and available for you on default.
This is a great way to get some more context on the bounce rate:
- Overall a session consists of 4,80 pageviews.
- For the non-bounce sessions, 8,04 pageviews per session are measured. (Non-bounce sessions consist of more than one pageview and/or include an event that is measured as an interaction).
The next step would be to focus on the non-bounce sessions and evaluate this segment against different metrics and dimensions.
And maybe even drilldown to include non-bouncers that don’t buy vs. non-bouncers that buy. It’s all about getting a first understanding of how you can make more visitors completing their goals and eventually convert.
On the other hand you want to get a more complete picture of the visitors that bounce on your website and how to better satisfy their needs.
And that is where I focus on in the rest of this article.
3. Bounce Rate per Device
Is there any issue with how your website displays on the different devices (desktop, tablet and mobile)?
It’s easy to find this out, navigate to Audience >> Mobile >> Overview.
 It doesn’t look like there is a huge difference between the device categories. Based on bounce rate measurements tablet performs the best and desktop the worst.
Tablet consists of only 3% of the total sessions so this segment will have a minor impact on the bottom line.
But even more important, how do people convert on desktop vs. mobile?
 Keep in mind:
- The overall bounce rate metric is far from actionable.
- Bounce rate numbers don’t tell the complete story.
- Always supplement bounce rate metrics with conversion metrics.
What would you prefer?
- Running a leadgen website with 90% bounce rate and 10% conversion rate (all website visitors either leave or buy).
- Running a leadgen website with 25% bounce rate and 2% conversion rate.
You get the point! This is exactly why these leadgen micro sites (one landing page) sometimes have bounce rates close to 90%, but still relatively high conversion rates.
Note: always analyze your bounce rate metrics in context (segmented dimension) and in relation to other important metrics (KPIs) on your website.
4. Bounce Rate per Landing Page
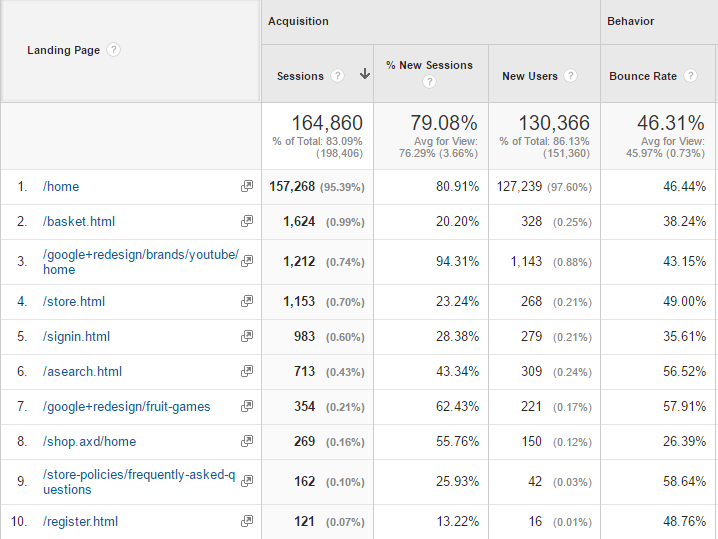
Navigate to: Behavior >> Site Content >> Landing Pages.
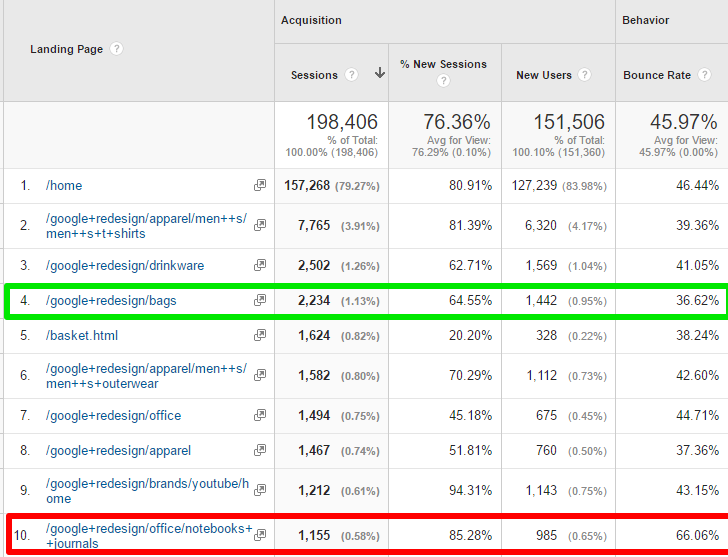
- 80% of the sessions have the homepage as their landing page.
- Most product (category) landing pages have a bounce rate lower than 45 or 40%. Landing page ten is performing the worst.
Use the comparison view to get a quick visual overview:
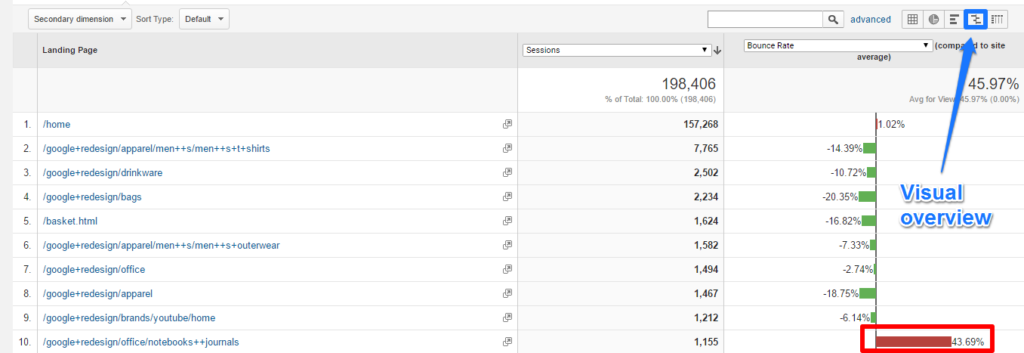
We see a lot of green bars here, simply because of the homepage skewing the overall numbers.
Let’s assume you want to exclude the homepage and basket page in this view:
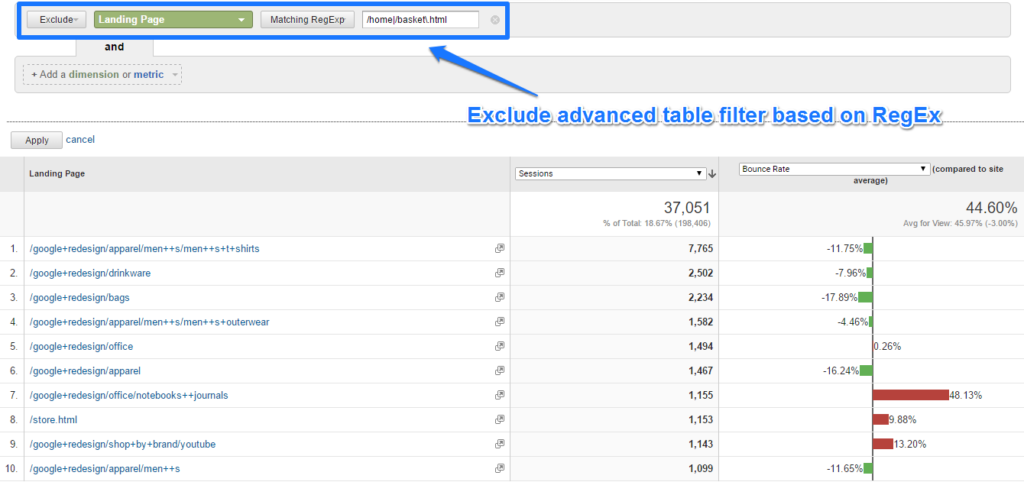 Make sure to read these posts if you are unfamiliar with setting this up:
- How to work with table filters in Google Analytics
- Ultimate guide to regular expressions in Google Analytics
5. Bounce Rate per Content Group
Content groups are very powerul to aggregate and analyze your content at a higher level.
I have written an extensive guide on why and how to set up content groupings if you want to learn more.
Google did a great job by setting up a few different content groups:
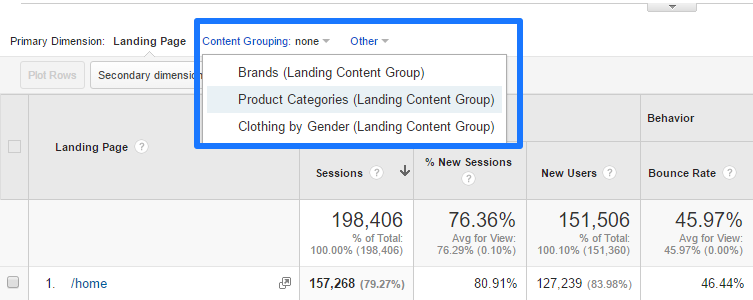
They allow you to analyze the landing page performance on three different levels:
- Brands
- Product Categories
- Clothing by Gender
Let’s dive into the Product Categories:
- Step 1: Select content grouping Product Categories.
- Step 2: Use an advanced table filter to exclude (not set) content grouping.
- Step 3: Change the default view to the comparison view.
And here we go:
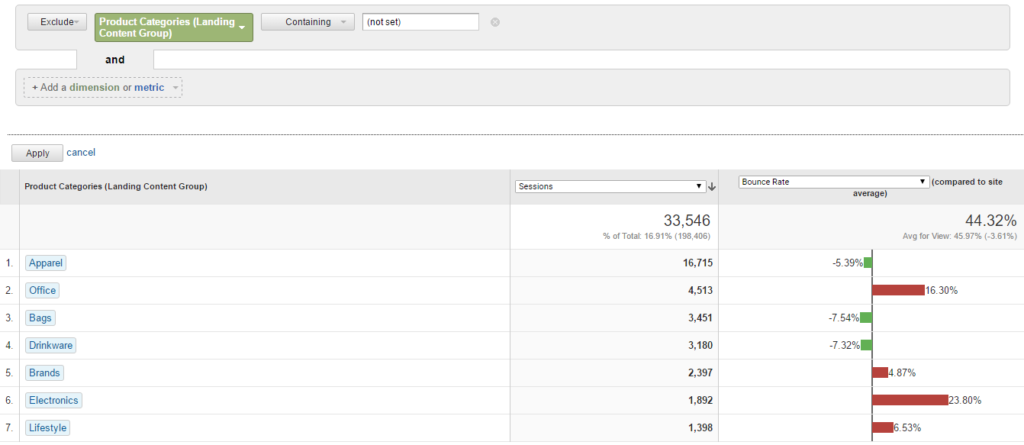 A few quick conclusions here:
- The product category pages contribute to 17% of the website entrances.
- Apparel is by far the largest category with 50% of the entrances in this group.
- Office and Electronics are the underperforming categories.
By analyzing these different content groups, you can pinpoint the areas that need to be improved on your site.
You could go one step further by including channel or source as a subdimension or analyzing conversion numbers as well.
My main point here is that you need to segment your numbers to find actionable insights in your data. But before you get lost in your numbers always make sure to come up with an important business question first.
Other useful segmentation analysis include but are not limited to:
- Channel / traffic source analysis.
- Device / browser analysis.
- Region analysis.
- Demographics analysis.
- Site speed / page level analysis.
Note: the (not set) group in a content group consists of the sessions that cannot be attributed to one of the category values. Click on (not set) group to find out which pages are included in this group.
Quick example:
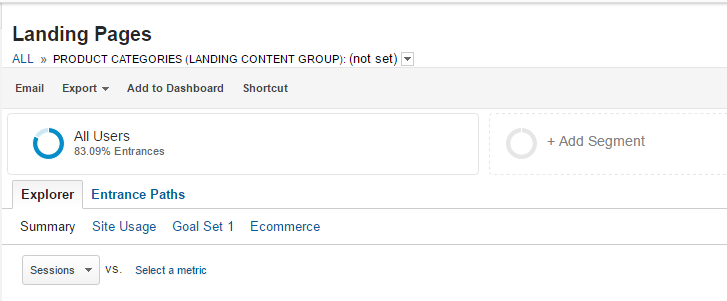 We saw that the sessions where the product category was defined were equal to 16,91%, so this is the other bucket:
 You now possess the skills to dive deeper into the bounce rate metric and analyze it against different relevant dimensions.
Reducing Bounce Rate
There are many different ways to reduce your bounce rate. In this chapter I will share ten ways to reduce your bounce rate.
1. Invest in Best Performing Channels
Let’s have a closer look at the Google Merchandise Store:
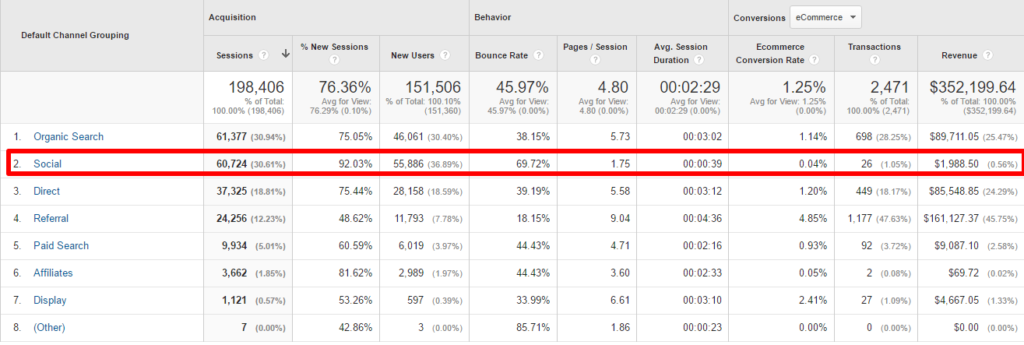
In this case “Social” is the second largest traffic channel. Bounce rate is 70% and Ecommerce Conversion Rate is close to zero.
Clicking through on Social reveals that this traffic is actually coming from YouTube.
Here is what happens after we remove “Social” traffic from this report:
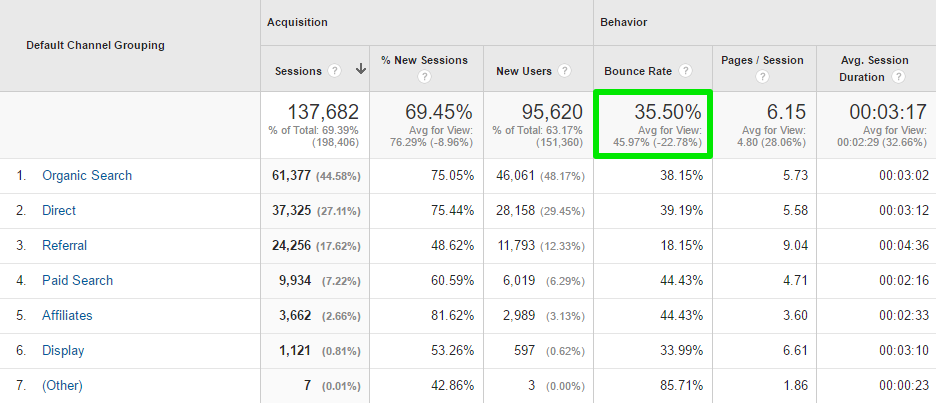 The overall bounce rate goes down from 46% to 36%!
This is a clear example of how one channel can skew an overall number. It should be clear by now that you always have to segment your main metrics.
2. Optimize Your PPC Campaigns
Running AdWords or other PPC campaigns can be very profitable.
However, I have seen dozens of companies setting up a campaign and after that just waiting for the money to come in. This is how tons of dollars are wasted every day.
Make sure that you only invest in keywords that generate a positive ROI in the long run.
Read this article to learn more about how to optimize your Google AdWords campaigns.
3. Create Suitable Landing Pages
Nothing is worse than a landing page that doesn’t reflect the offer in the ad. This will skyrocket both your costs and bounce rate.
The Conversion Trinity is one of the concepts to take into account if you aim to reduce the bounce rate and improve conversions.
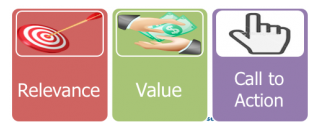
- Relevance. Are you relevant to my needs (search query)?
- Value. Do I know why you are the right solution for me?
- Call to action. Is it obvious what I need to do next?
4. Create Compelling Call-to-Actions
It doesn’t matter whether you run an ecommerce site or a blog, compelling call-to-actions can greatly reduce your bounce rate.
In this post 31 call-to-actions are shared. It’s a great read!
If you help your visitor answer the question “What to do next?” you will do fine!
This will help to reduce the bounce rate on content pages and increase conversions from product and services pages.
5. Improve Page Load Time
Your visitors expect the page to load in two seconds or less.
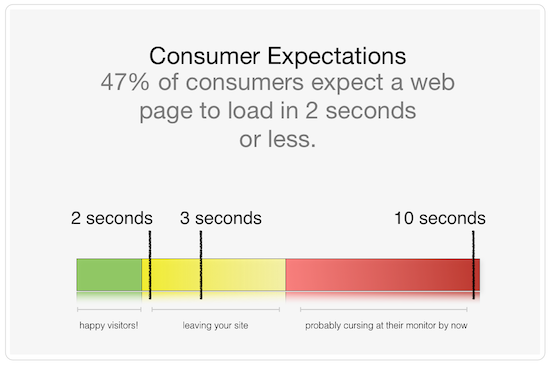
Quick Sprout contains a compelling article on how to make your site insanely fast.
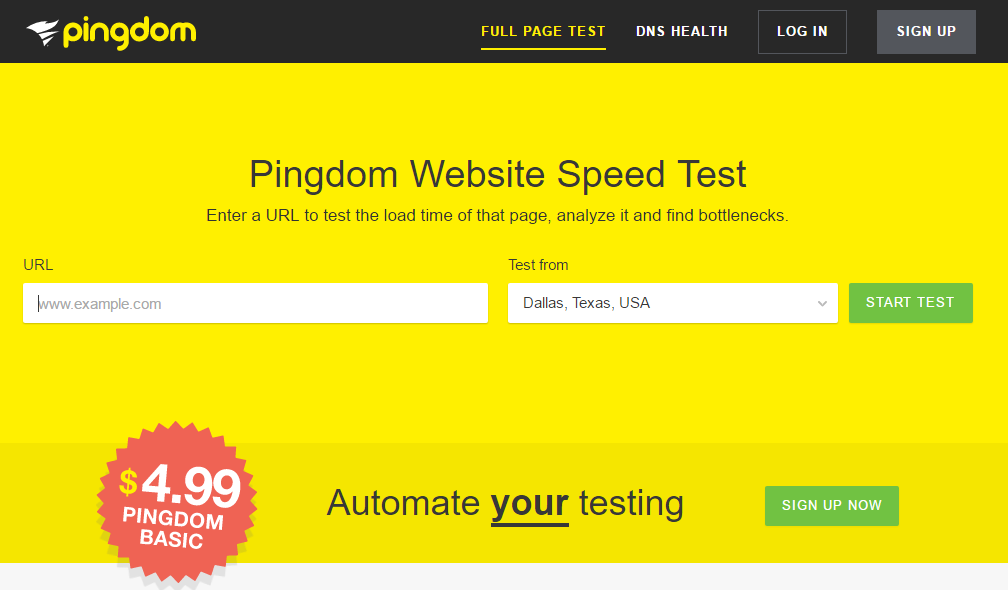
There are a few great tools out there for Sitespeed Testing. One of them is Pingdom.
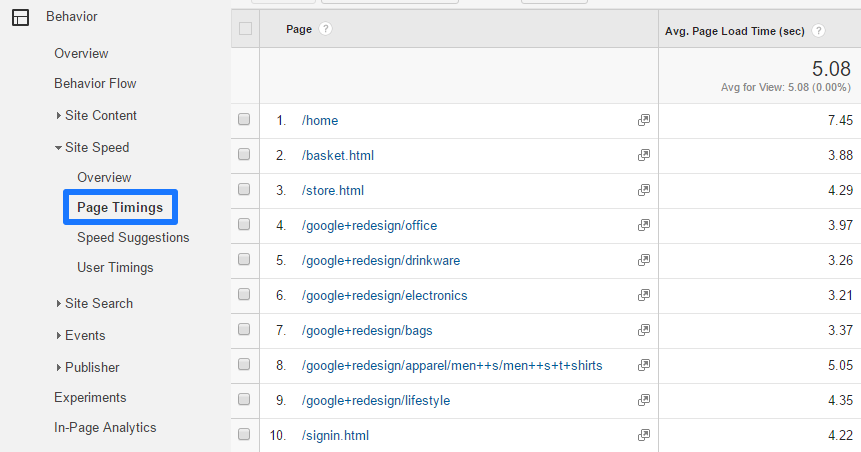
Google Analytics can help you here as well. Especially useful if you want to analyze your site speed numbers in greater depth.
Navigate to Behavior >> Site Speed >> Page Timings.
6. Use Interaction Events Where Appropriate
You don’t want to implement interaction events based on scroll depth. This because it would greatly reduce your bounce rate but at the same time negatively influence the relevancy of your data.
Like I mentioned before, there are certain events you want to trigger as an interaction that influences your bounce rate.
Let’s say you run a travel website and have a “call us” button embedded on your site:
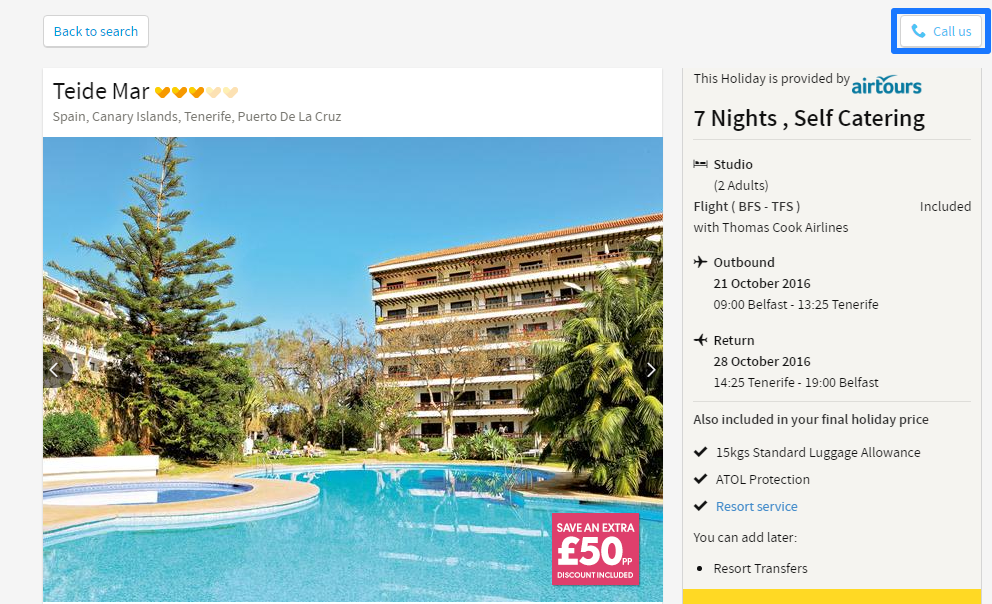
This pop up appears after you click on the button in the top right corner:
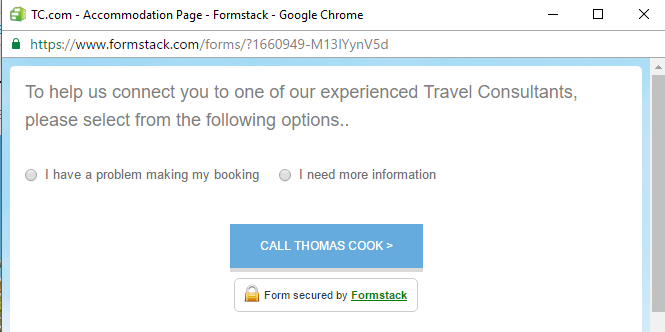 The pop up is on a different URL and will in most cases not be tracked (automatically).
As an analyst I like to know how many people click on the “call us” button and how many clicks end up in a call.
I recommend to implement an event to measure clicks on the “call us” button and consider it to be an interaction event.
It means that if someone would land on this page and clicks on the button without seeing any other pages in her session, the session would not be counted as a bounce.
7. Run Page Level Surveys
Very often 20% of the pages of a website account for 80% of the traffic.
What if these key pages have a very high bounce rate and low conversion rate? Of course you need to put in some efforts to optimize these pages and find out what needs to be improved.
Your visitors can help you fix these pages.
That’s when on-page surveys can be really helpful. Find out the reason why people directly abandon your website on these pages by asking highly targeted questions.
There are dozens of tools out there that can help you.
I have used Qualaroo extensively in the past.
Although I think that their pricing really changed (no cheap price models anymore), it’s still a great solution to consider:
- Target question on very specific behavior.
- Skip logic to set up and guide visitors through multiple questions in a survey.
- Tons of integrations, e.g. with Google Analytics.
- Exit surveys with smart deployment.
- Question library for storing your “best” questions.
- Complete customization (based on your logo and color scheme).
On the other hand, if you don’t need all functionality that Qualaroo provides, HotJar might be a great alternative. It’s a solid option if you are just starting out and it contains a bunch of other great features as well.
8. Create a Mobile-Friendly Site
Comparing the mobile numbers against tablet and desktop is one of the first things that I do when working on a new project.
Unfortunately still a lot of companies lack in providing a good mobile user experience. That’s why bounce rate can be dramatically high and conversion rate very low on these devices.
Lower conversion rate numbers can also be due because of visitors wanting to convert on desktop or tablet. However, a relatively high bounce rate on mobile indicates that something is wrong.
Here is an example (Travel website):

On mobile, the bounce rate is almost double compared to the bounce rate on desktop. That is a dramatic difference and as you can see mobile accounts for 20% of the traffic.
In a world where mobile becomes more important every day, you need to get a mobile friendly site asap!
This simple tool from Google helps you to determine how mobile-friendly your current website is.
9. Create Trust and Credibility
It’s extremely important to establish trust and gain credibility on your website, especially if you sell a product or service.
In my opinion qualitative testimonials or score reviews of customers are a great way to increase your credibility.
What would you prefer:
- A product page with zero reviews that lacks clear product information and good pictures.
- A product page with an average review score of 4.9 (max 5.0) based on 112 reviews, in-depth product information and 3D pictures.
You can imagine that the bounce rate is highly influenced by the first impression of your visitor.
Make sure to establish trust on your entire website and especially on your most important landing pages.
10. Improve Content Readability
Did you know that content readability can have a great impact on bounce rate? Short, clean paragraphs tend to do better than long paragraphs.
Most website visitors “scan” content and only read what interests them.
Therefore it is important to always keep your readers in mind while designing your site and structuring your pages. So that you make an appropriate choice in design, fonts etc. and keep your bounce rate as low as possible.
Adjusting Bounce Rate
A word of caution first, don’t adjust your bounce rate numbers if you’re relatively new to Analytics! This is an advanced topic and should only be applied by experienced Analytics users.
In the past I wrote a guide on implementing adjusted bounce rate on your website.
On my website I have modified the default bounce rate metric to gain better insights in the performance of my website and individual pages.
Here is why:
- In general I write blogposts of over 1.500 words and sometimes even close to 4.000 or above (like this one).
- There are many people that visit my website and read my latest posts. They will naturally just visit one page.
- I believe that spending a certain amount of time on a page (especially a blog) shows engagement and interest in the topic.
Without adjusting the bounce rate metric, a blog usually has a bounce rate of close to 70% or even much higher.
That’s why I decided to implement a time specific bounce rate on my website to get a better understanding of the performance of each of my pages.
You have to experiment yourself with what works best, e.g. 30 seconds, 60 seconds, 120 seconds etc.
Here is what I learned in my bounce rate case study.
How to Analyze Bouncers
Even after implementing adjusted bounce rate on your website, you can still analyze your normal bouncers segment.
You can do this by leveraging segments in Google Analytics.
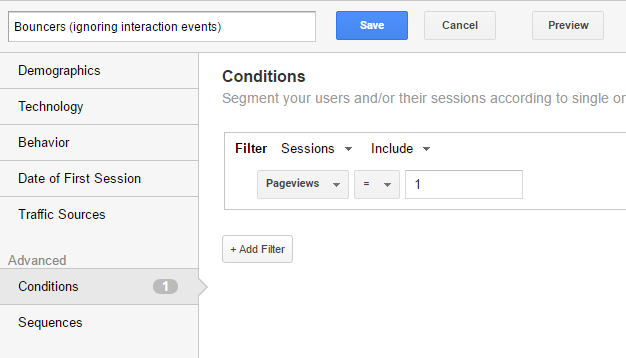 The segment above will show you the bouncers, but ignores any defined interactions events.
You can expand the segment to show the bouncers while taking into account any defined interaction events:
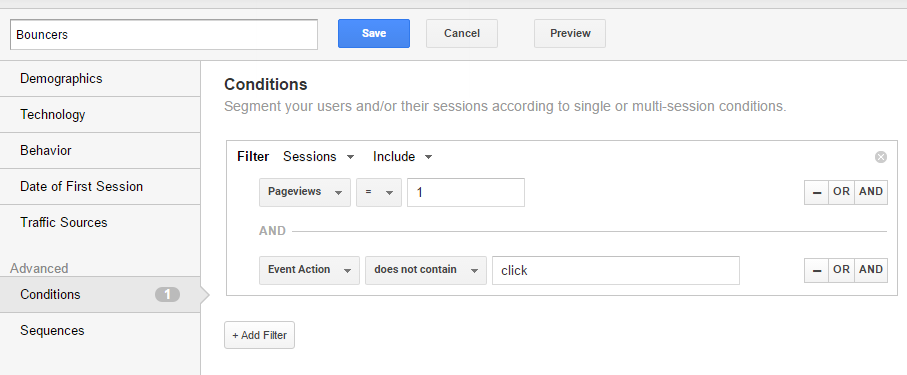 In the example above I assume that any triggered event with event action equals click, is an interaction event.
So by adding a “does not contain” segment to the original segment setup I make sure to adjust the bouncers segment based on interaction events that occurred.
Three things to keep in mind:
- Adjusting your bounce rate numbers can have a dramatic influence on your stats, so make sure you know what you are doing. You might want to set up a second property for this to not influence your original data collection.
- You can also set up a time-based event that doesn’t influence your bounce rate numbers.
- You can still analyze your original bounce segment if you are skilled in using the segment feature in Google Analytics.
Concluding Thoughts
I hope by now you have learned a ton of new things about interpreting, analyzing and optimizing your bounce rate.
This is much more important than comparing your bounce rate to average bounce rates and industry benchmarks. I am 100% convinced that you will be able to reduce your bounce rate if you apply the strategies and tips in this article.
Reducing your bounce rate is a crucial first step and will naturally lead to higher conversion rates if you do a good job in guiding your visitor towards the final conversion.
As a final remark, maintaining scent is the best way to turn a non-bouncer into a customer!
What did I miss? Is there anything that I should add to the article? Happy to hear your thoughts in the comment section!
One last thing... Make sure to get my automated Google Analytics 4 Audit Tool. It contains 30 key health checks on the GA4 Setup.
Very Good – will need to re-read I think as lots of good information here. I think Avinash has changed his view on bounce rate and updated his post or at least I have seen an email on this topic. Wish clients didn’t focus so much on this metric though! :)
I am glad you like the post Richard! Yeah, nowadays Avinash sends out information packed newsletters quite often in addition to his blogposts. Maybe I missed something. :-) Always good to remind your clients to place the bounce rate in perspective to other (conversion) metrics and segmentation is key here!
Hey Paul,
Great article on analyzing and optimizing bounce rate. I am a newbie when it comes to Google Analytics. So I didn’t understand “adjusted bounce rate measurements based on timings” part. Hope you can suggest me a link.
Hi Sunny,
I am glad you enjoyed reading this post. If you are new to Google Analytics, I highly recommend not to think about adjusting bounce rate measurements and work with the default one. Things get too complicated and you might mess up your data if you don’t know exactly what you are doing.
Best,
Paul
Hey, Paul!
It is one of the best ever article I read on bounce rate. Well explained and worthy to read. High bounce rate whether on desktop or mobile, indicates that the users are not getting what they are expecting from you. When it comes to mobile, the problem gets more severe. The tips you have mentioned here play important role in making the user stick around.
Hi Peter, thanks a lot for your comment, I appreciate it! And you are right about mobile.
You have shared a wonderful post it’s very informative. Thanks for sharing it.
Thanks and I am glad you like it!
Hello! Great article.
I keep reading about the Bounce Rate but there is something I still don’t get. I’ve come to understand the Bounce Rate is the number of sessions with only one pageview (is this a right vision?). That the user comes to the page and that’s the only page he/she sees before going away. But sessions are involved, so my question is: If you come to the page and you don’t act upon it, how does it coun’t as a session with only one page? Shouldn’t there be more hits to be a session?
Best regards,
Alexandra
Hi Alexandra,
Thank you for your comment. The bounce rate is the number of sessions where the entry page is also the exit page and where the user didn’t further interact with the page.
So in case you set up event tracking (as an interaction hit), a click on a certain element. might impact your bounce rate. Without event tracking implemented a bounce is a single page session.
Hope this helps!
Paul
Hi Paul, first of all I have to say that this is a great article so thanks for that.
Earlier this year I launched a new website and I noticed a significant increase of my bounce rate. With the former website I was using event tracking for all the clicks (hyperlinks and Calls to action), but it’s no longer the case with the new one. I only track a few of them. From what I understand, that could explain why my bounce rate increased. Does that make sense?
Thank you,
Thanks for your comment! Yes, lowering the numbers of events tracked could lead to an increase in bounce rate; especially if you were tracking all hyperlinks and call to actions. This is only the case when the events where tracked as interaction events. Hope this helps!
Hey Paul
I have a question about bounce rate and exit rate:)
In Behavior > All Pages report, Bouce Rate of pages in my site are more than exit rate (not always)
This is confusing me a little!
when user bounce on my home page, they exit too right? and beside that, some of non bounced user may exit at home page
So how could bounce rate can be more than exit rate?
Hi John,
This is quite a tricky topic to explain.
Here is an example where bounce rate is higher than exit rate on home page.
Three sessions in total:
– Two entrances on homepage, both a bounce -> bounce rate on homepage is 100%.
– One entrance on “about us” page, visitor navigates to homepage, after to PDP and exits the website.
In this case the exit% on homepage will be lower than the bounce rate (66,66%). As in the third session the homepage is visited, but the user doesn’t exit there.
Hope this helps!
Paul
Thanks for this helpful content Paul!
I just wonder that what do you think of adjusted Bounce Rate?
I’m currently producing blogpost for my website twice a month. Do you think that is is allow to get better insights via GA?
All the Best
Hi Peter,
Yes, it can be more helpful when analyzing blog posts. But don’t interpret it in an isolated way. Also, look at your micro and macro conversions – bounce rate alone is not a strong enough indicator of performance.
Best,
Paul