Communicating your results is a crucial part of A/B testing. It’s a no-brainer that you need to have excellent written and verbal communication skills.
And you might wonder, what information should I include in my A/B test report?
Do you already have a report framework in place? Great, I expect you to learn a few things here on how to further improve it.
You don’t have a framework yet? No problem, you’ll walk away with practical tips on how to build your next A/B test report.

In my experience there are 10 elements you should consider to include in your report. Always keep in mind who is actually going to read it and change the structure if needed.
And don’t overdo it; most often 10 slides is more than enough to communicate the outcome of your A/B test.
1. Test Period
It might sound like a no-brainer to you, but make sure to always include the test period and exact dates of when the test did run.
Did it run for one week, two weeks, three weeks or even longer?
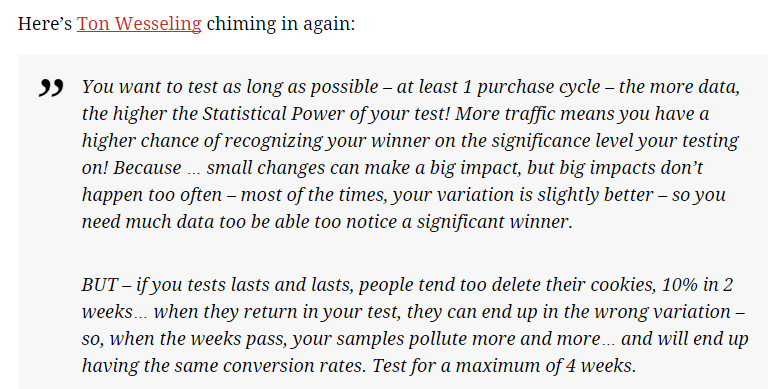
As a general rule you want to run your test for full weeks and include at least one conversion cycle.
This is what Ton Wesseling (CRO expert) had to say about this topic on the ConversionXL blog:
 2. Pre-Analysis
Testing without any pre-analysis is like playing roulette in the casino.
You might win or you might lose, most often it is just a lucky shot if you win.

Quantitative and qualitative data analysis – with tools like Google Analytics, Hotjar, Qualaroo – should be done before you start with A/B testing.
These analysis will feed you with possible test ideas. What leaking buckets do I need to fix first?
It is a best practice to include the pre-analysis findings that are directly related to your test in your A/B test report.
3. A/B Test Variations
Let’s keep it simple here. You decide to test your original (default) homepage against one variation: variation B.
Anyone who receives your report needs to know what you have actually tested.
Make sure to visually show your A/B test variations on one page.
Are you in doubt about whether people can really see the differences? Use some additional comments or zoom in to make things really clear. You don’t want your audience to guess what the changes are.
4. Hypothesis
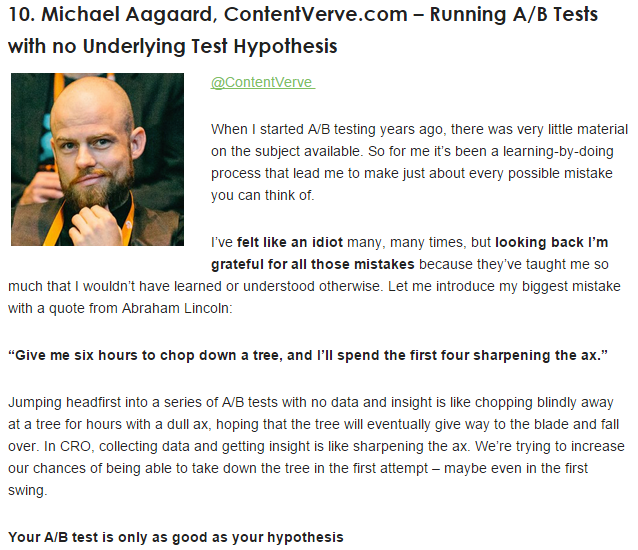
I strongly recommend to never A/B test without a proper hypothesis. You clearly need to describe the reasoning behind a test.
This is a tip of Michael Aagard, who joined Unbounce on 1st July, on formulating a hypothesis:
 This format will help you to easier come up with a good hypothesis.
And make sure to back up your hypothesis with reliable data, both quantitative as well as qualitative. I can say that I fully agree with him. Invest extra time in your data analysis and you have a better chance in finding winning A/B test hypothesis.
It will pay off big, trust me!
5. Most Important Results
In theory you could run an A/B test with a micro or macro goal in mind.
Most companies run their tests on one or more of their main conversion points (macro goals):
- An ecommerce site could aim for more sales and a higher average order value
- A leadgen site tries to expand their lead database
- A hotel site wants to sell more hotel rooms (and would benefit from selling more higher-priced rooms and rooms that include breakfast as well)
No matter what your exact goal is, you always want to include the results in your A/B test report.
At a minimum aim for:
- Number of visitors in each variation (default and variation B)
- Number of conversions for each variation
- Conversion rate for each variation
- Conversion rate uplift (positive or negative)
- Significance level of your test (p-values)
Remember to define upfront which segments you are going to look at after your test:
- Overall
- User type (new, returning)
- Channel (SEO, SEA etc.)
- …
Why? If you segment long enough, you will always find a winner within a specific segment.
Unfortunately most A/B test winners are illusionary, find out why:
6. Relevant Side Analysis
Don’t just throw in extra numbers without a good reason. It should benefit the story you are trying to get across.
Let’s look at an example:

Imagine you are in charge of this amazing hotel located on a beautiful, healthy island Okinawa in Japan.
Your job is to get more bookings through conversion rate optimization.
You have decided to test this page against another page with less distractions. This variation includes:
- Less navigational elements
- More focus on the search box
- A few more small tweaks
You are happy to report that you found a significant increase in conversion rate of 8,6%!
Besides that you saw in your data that bounce rate and exit rate decreased and the average time on this page (compared to the default) is dramatically lower.
Well, in this case you might want to include these stats in your report. It could indicate that people more quickly make their decision because of less distraction on the page.
I hope you get my point here! Only include a side analysis if it adds value to your story.
7. Predicted Uplift in Revenue or Margin
You have found a winner, great news and now what?
Well, don’t stop at the conversion rate uplift. Your boss or client is interested in $$$, trust me.
Do the math and discover the extra revenue or margin that is expected if your company or client implements the winning variation.
You could say, after 1 month or 3 months we expect the extra revenue or margin to be this much.
Tip: include a confidence interval as well.
In other words, the expected extra revenue will be between x and x $$$.
8. Conclusion
I will explain this part of the A/B test report with a fictional hypothesis:
“By removing the navigation bar on the booking step page, visitors are less distracted and as an result more visitors will place an order.”
Let’s assume that a significant uplift of 6,4% is found. Your conclusion would be as follows:
“Removing the navigation bar on the booking step page has a (measured) positive effect on conversion rate.
Things to keep in mind:
- An A/B test has two possible outcomes: there is a measured positive effect or there is no measured positive effect
- You need to run multiple tests to confirm or reject a more general hypothesis
9. Learnings
Where a conclusion is a general statement attached to your hypothesis, learnings are more concrete, validated take aways from your experiment.
Learnings can be formulated on the overall level, but on a deeper segment as well.
Examples of learnings:
- Using a self-efficacy technique – by adding green checkmarks if visitors have filled in a form step correctly – leads to a higher conversion rate on tablet
- Adding positive, cheerful pictures on the homepage, leads to more repeat visitors booking a hostel
- Visitors from search convert better if the ad message is replicated on the landing page

10. Recommendations
You have almost finished your report and there is one important thing left: the recommendations or next steps.
What is your advice based on the A/B test outcome?
I will make it simple for you. In general there are four possible routes to take:
- Do nothing (if there was no significant positive effect measured)
- Re-test your findings (example: you test with a 90% significance level -> 1 out of 10 test winners is a false positive. Since the implementation is expensive you want to re-test your findings to become more certain that you have found a winner)
- Implement winning variation (via your A/B testtool you could temporarily sent all traffic to the winner)
- Site-wide test (you think that the message, design or other change is not just bounded to the tested template. You decide to test it on other parts of the website as well)
I am happy you stayed here with me to the end. Put these things in practice and contact me if you need any help!
Do you have any tips about how to best structure an A/B test report? Happy to hear any comments.
One last thing... Make sure to get my automated Google Analytics 4 Audit Tool. It contains 30 key health checks on the GA4 Setup.
Leave a Reply