What’s the difference between Google Analytics App + Web and Universal Analytics? In this blogpost we will explore the differences between both versions of Google Analytics.
App + Web is not a simple upgrade to Universal Analytics. It’s a new version that comes with an event-driven data model aimed at collecting data from both web and app.
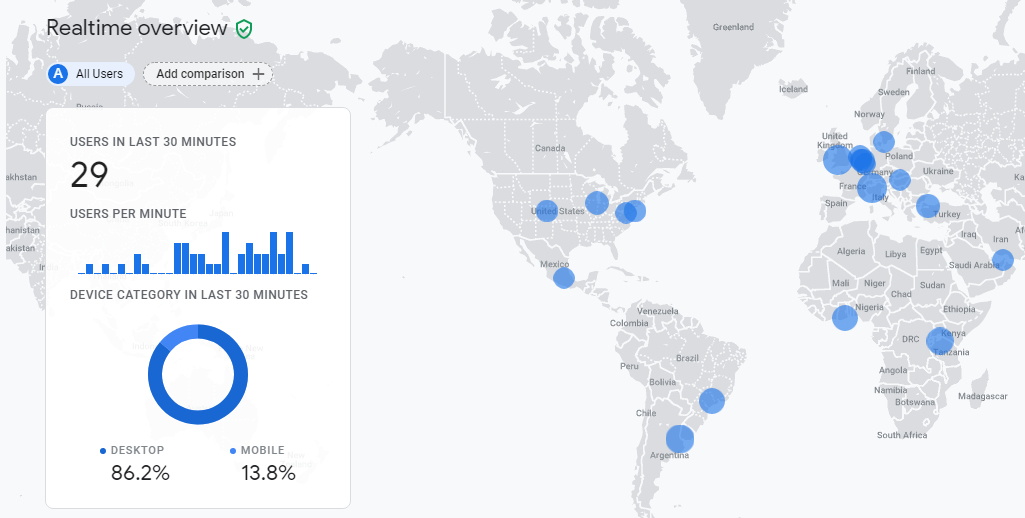
“Hey… wait. Our business doesn’t have an app!”
It might sound a bit confusing, but Google Analytics App + Web properties are also perfectly applicable to web only businesses.
In this post I will share 25 key differences between both versions. This to further educate you on the direction that Google is heading with Google Analytics.
Table of Contents
1. Data Model
The biggest change is that Google is moving away from the measurement model that was primarily focused on sessions and page views. They have definitely tried to make user metrics and dimensions more central, but a lot of times sessions remained on the foreground.
Here is a property level setting of Universal Analytics related to pushing user metrics in reports:

In Google Analytics App + Web this has dramatically changed as there is a strong focus on users and events. Every interaction, including page views, are categorized as events. You can add 25 custom parameters to each event, but be aware of limitations which I will discuss later.
2. Data Streams
In Universal Analytics (Google Analytics Standard Property) you need to create separate properties for Web, iOS Apps and Android Apps.
Well, that’s not 100% true because you can create roll-up properties that contain both Web and App data if you are on GA 360. However, as you can read this is far from ideal and only suitable for largest companies with high budgets.
Google Analytics App + Web (as the name already implies) is a complete new solution for integrating web and app data. Reports for this new property use a single set of consistent metrics and dimensions, making it possible to see integrated reporting across app and web like never before.
You can set up multiple data streams and see aggregated reports.
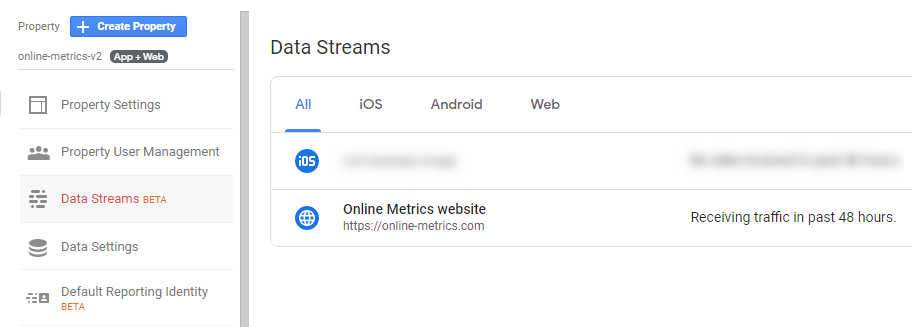
Keep in mind that you can only add data streams for “Apps” and “Apps and Web” properties. “Web” properties (standard / Universal Analytics) have views instead of data streams and a default view is created automatically when you create this “legacy” property.
At the time of writing, you can create up to 50 data streams per property which should be enough for most of you. :-)
3. Google Analytics Code
Universal Analytics’ tracking code is based on UA-XXXXXXX. This is different from when you implement a Google Analytics App + Web property as it is based on Gtag with a measurement ID (G-XXXXXXXXXX).
A Google Tag Manager basic tag setup example is shown below:
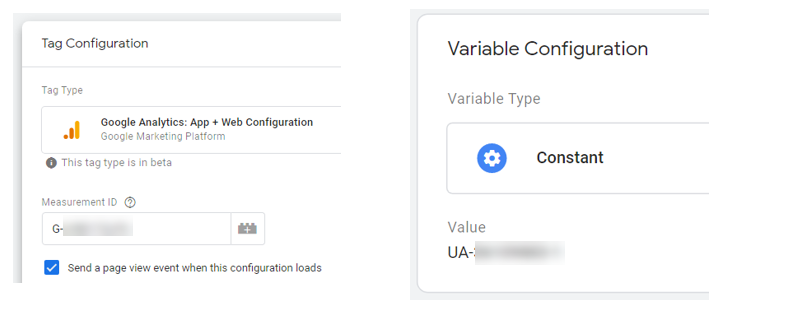
- Left side: Google Analytics App + Web Configuration tag which includes a measurement ID.
- Right side: Constant Variable created for the Universal Analytics tracking code.
4. IP Anonymization
The process of IP anonymization in Universal Analytics takes place within two steps in the collection pipeline: the JavaScript Tag and the Collection Network. These steps are explained below.

In Universal Analytics you have the option to implement this feature (not applied on default).
In App + Web properties Anonymize IP is automatically set and there’s actually no way NOT to anonymize the IP.
“When you anonymize an IP, it might negatively impact the city location data in GA. In my experience, there is no big difference in accuracy at the continent or country level.”
5. Cookies
The Google Analytics App + Web properties use not one but two cookies in order to perform the website tracking.
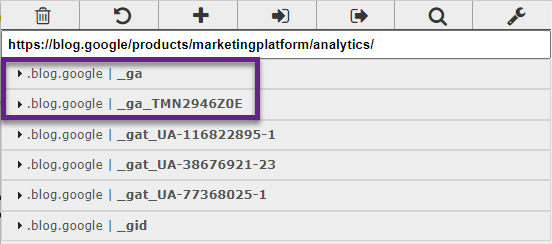
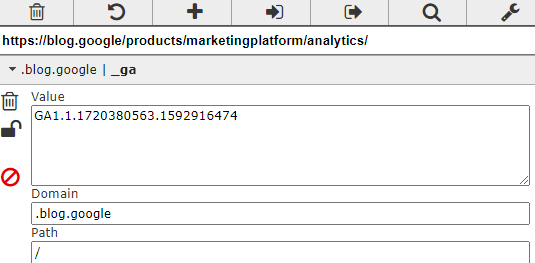
“_ga” cookie, nothing changed (compared to Universal Analytics), it holds the current user ClientID.
“_ga_XXXXXX” cookies, we’ll find a new cookie for each of the Measurement ID’s that you’re using on your site.
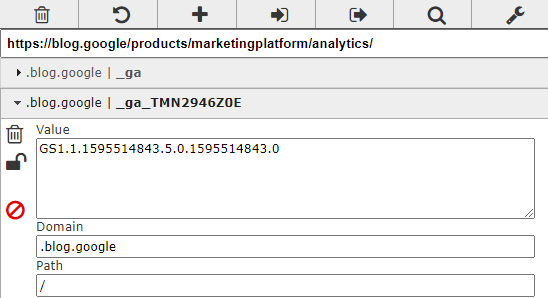
Cookie expiration time of both cookies is set to two years. The cookies are updated every time data is sent to Google Analytics.
6. Default Measurements
With respect to default or baseline measurements, there is a big difference between Universal Analytics and Google Analytics App + Web.
Where Universal Analytics only accounts for page views and screen views, you will find that Google Analytics App + Web offers many more possibilities.
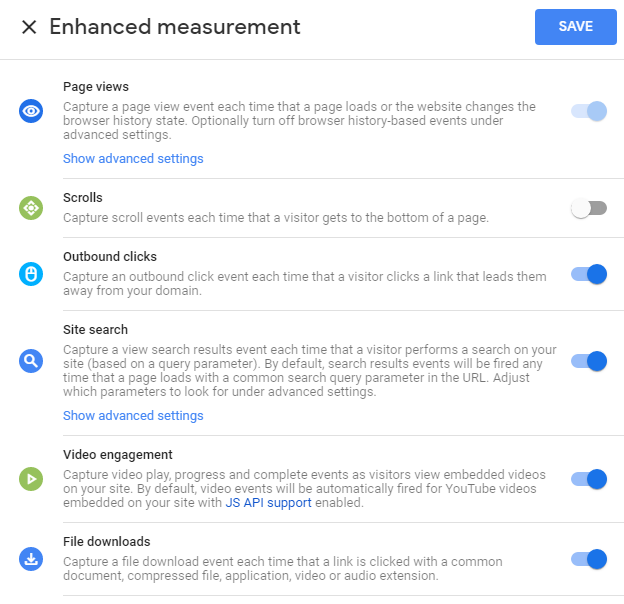
In addition to page and screen views, you have the option to automatically integrate:
- Scrolls
- Outbound clicks
- Site search
- Video engagement
- File downloads
Read my post on Enhanced Measurement in Google Analytics App + Web to learn more!
7. Event Tracking
In Universal Analytics, we are all used to Event Tracking and its role in measuring many different interactions on a website. Page views are an exception and not counted among events. Events are categorized by Category, Action and Label.
![]()
In contrast, in App + Web properties everything is an event (including pageviews).
![]()
Also, App + Web events don’t come with the same structure. They work with so-called custom parameters. Here is great guide from Simo Ahava explaining this in all depth.
8. Engagement Tracking
In Universal Analytics, there are several ways to track “engagement”. You can think of the bounce rate metric, time on site and number of pages per session.
There has been a lot of discussion around the way engagement is tracked in Universal Analytics. Is the bounce rate metric really meaningful for analysis and optimization? It definitely delivers some insights in my opinion, but it is not ideal.
Google Analytics App and Web comes with a different approach to engagement tracking:
- Engaged sessions
- Users that are on the site/app for at least 10 seconds. If a user is on the site for less than 10 seconds, they are defined as a bounce.
- Engagement Rate
- Engaged sessions per user.
- Engagement time
- Time in the foreground within apps. Engagement time diagnoses screen sleep time, or captures the time in the foreground for a mobile device, to determine how a user is engaging with your content. This was previously only available to Firebase users.
Let’s wait and see whether these metrics are more useful for the regular Google Analytics user!
9. Sampling
One of the pains in Universal Analytics is sampling.
Default reports are not subject to sampling. However, ad-hoc queries of your data (e.g. after segmentation) are subject to the following general thresholds for sampling:
- Analytics Standard: 500k sessions at the property level for the date range you are using.
- Analytics 360: 100M sessions at the view level for the date range you are using.
In App + Web, the standard reports are always unsampled. In my experience, you can apply data comparisons, secondary dimensions, filter your reports and everything will continue to be unsampled.
In this insightful blogpost, Charles Farina has pointed out how sampling affects custom reports / analysis section of Google Analytics App + Web.
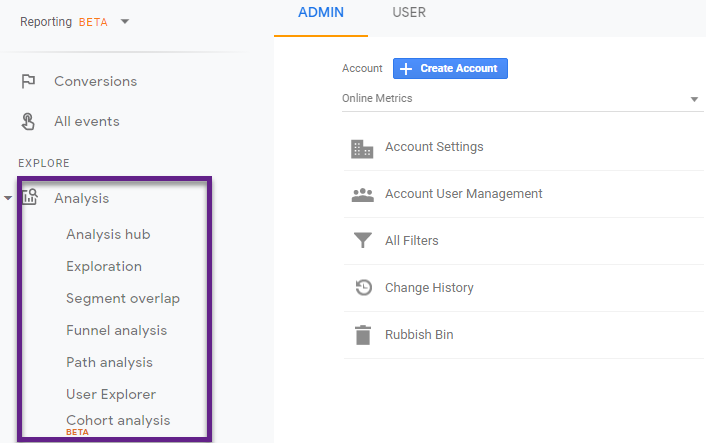
Here is what Charles found out through testing:
“In general, anything you do in Analysis that replicates a standard report will be unsampled. Sampling can occur in a few different situations that I was able to observe. The main occurrence of sampling in Analysis is anytime you are exceeding 10 million events and the report you created is not a pre-existing standard report. For example, the cohort analysis will load unsampled for a property I was using with 100 million events, but as soon as I added the date dimension, it returned 10% sampled data (10/100m). Another area, where I observed sampling being triggered in certain situations was when my date range exceeded the last 60 days.”
10. Historical Data Limit
In Universal Analytics there is no historical data limit (if you set it not to expire as shown below).
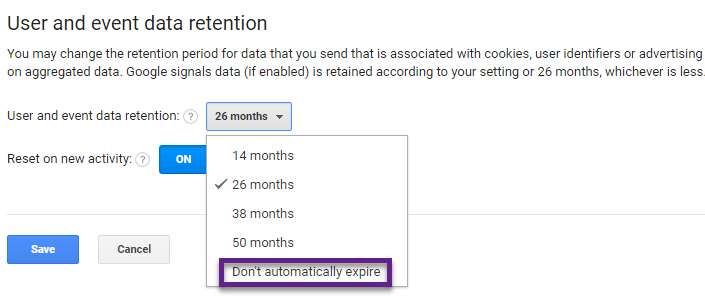
This is different from the new settings in Google Analytics App + Web, where you can query at most 14 months of data in the UI.
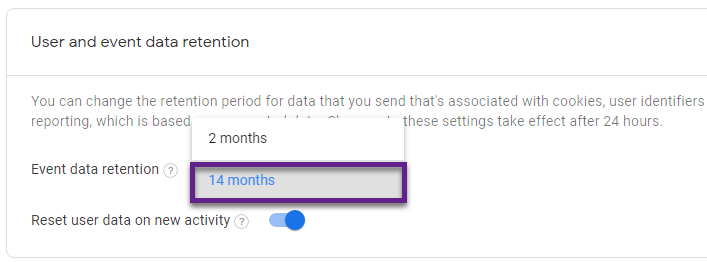
Good news! If you are a bit more technical and use Google BigQuery, you can work around this. In BigQuery an unlimited amount of data can be stored.
11. Ecommerce Measurement
One of the great features of Universal Analytics is Enhanced Ecommerce.
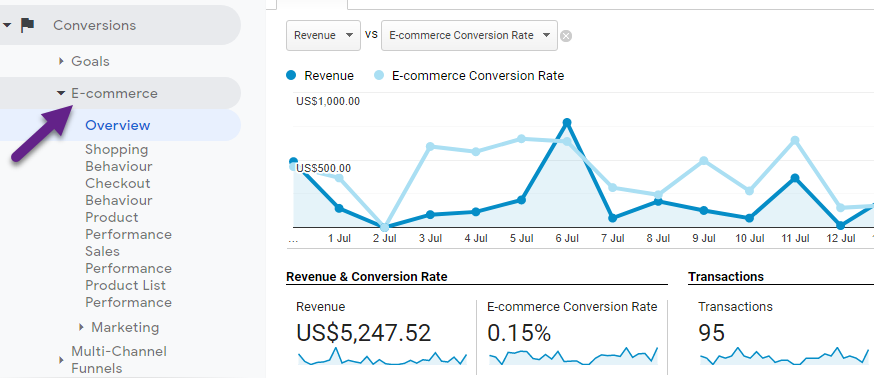
Ecommerce reporting is now also available in Google Analytics App + Web which is great!
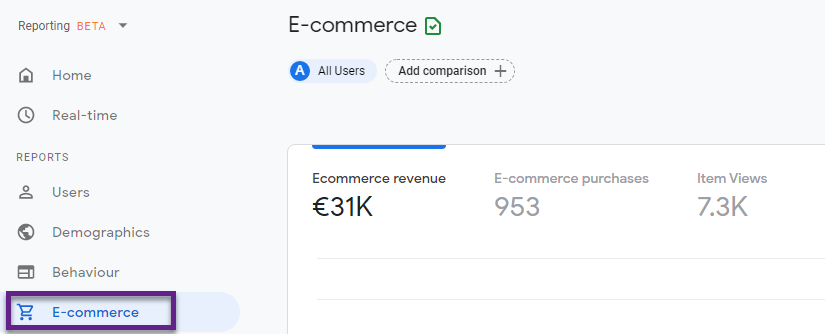
Here is a support guide from Google explaining the Data Layer as well as Custom JavaScript variable implementation.

You might also want to look into this Ecommerce App + Web guide to learn how to implement it!
12. Session and User Analysis
In my opinion, segments belong to the top three features of Universal Analytics. In the last ten years I have probably set up and explored 1000+ different segments. They are so useful for deriving insights and optimization.
And yes, they are still there in Google Analytics App + Web. And even more powerful!
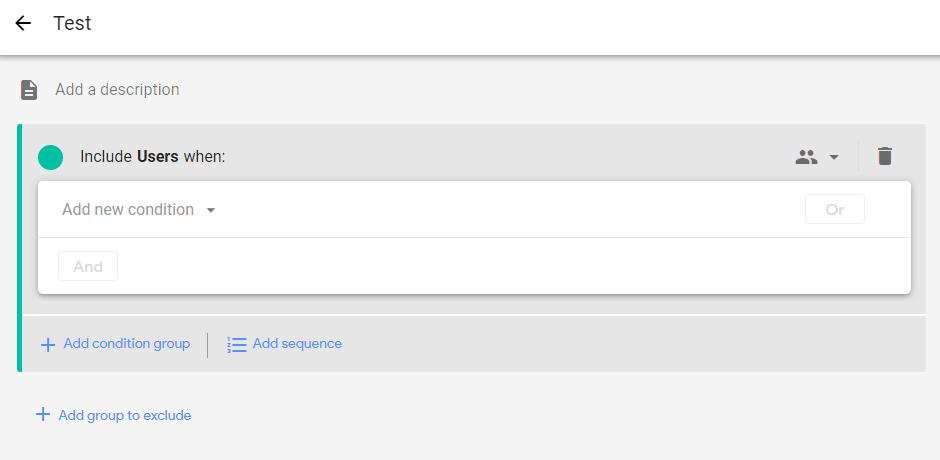
You create an audience by setting conditions based on the dimension, metric, and event data you collect from a property. After you create an audience, it accumulates users who meet the conditions from that point onward.
By linking your App + Web properties to your Google Ads account, you can use the audiences you create from your website and app data as remarketing lists in Google Ads.
When you create a new audience, it can take up to 24-48 hours for the audience to accumulate users.
They have become even more powerful after this recent update.
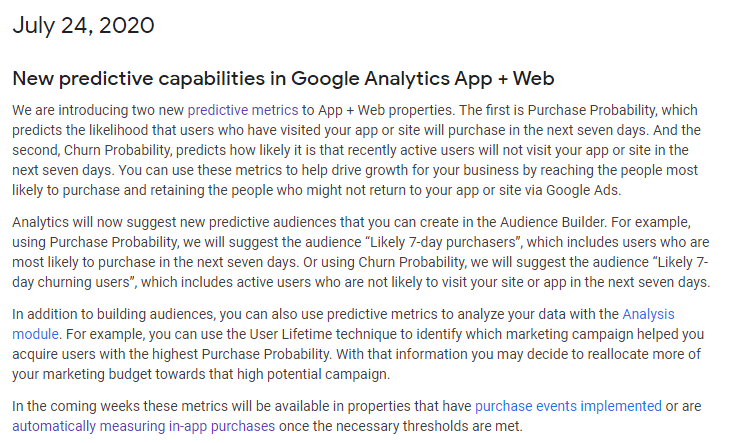
Explore the possibilities and test them, the best way to understand how powerful they are and to start leveraging them for your business!
13. Custom Metrics
Custom Metrics belong to one of the useful, but underused features of Universal Analytics. They allow you to store additional (numeric) data that is not captured on default in Google Analytics, e.g. cart value, list and sale price, % read ratio (blogpost) and much more.
Also, you could “promote” certain events and measure them as well with a custom metric. This is a great strategy to analyze them across certain dimensions. Here is a great example of Yehoshua Coren.
Let’s take a look at Google Analytics App + Web properties. The traditional concepts of Event Tracking, Custom Metrics and Custom Dimensions are not there anymore. Now we need to get our head around events and applying custom parameters.
Here is an example on Simo Ahava’s blog:
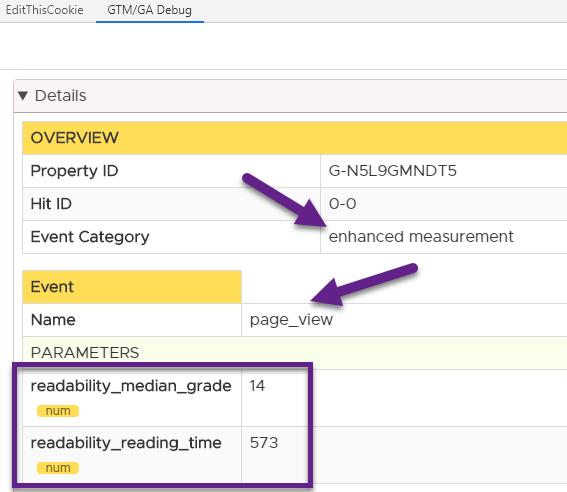
As we have discussed before, page views are part of the events categorized under Enhanced Measurement.
In the screenshot above you can see:
- Event name: page_view.
- Custom parameter (num): readability_median_grade.
- Custom parameter (num): readability_reading_time.
It means that Simo has defined extra numeric values (via custom parameters) to add more details to the page views (blogposts) captured in Google Analytics.
This is the new way on how you can send extra numeric data to Google Analytics. And it is not limited to page views, but can also be applied to ecommerce events or other events that are important to you.
14. Custom Dimensions
Custom dimensions are very useful as well and as mentioned they are available for Universal Analytics. You won’t find them anymore in Google Analytics App + Web properties.
In App + Web these custom dimensions are replaced by User Properties. You can find them in Google Analytics under the “configure” tab.

You need to work with your developer (or have JavaScript knowledge yourself) to set up the rest of tracking via Google Tag Manager.
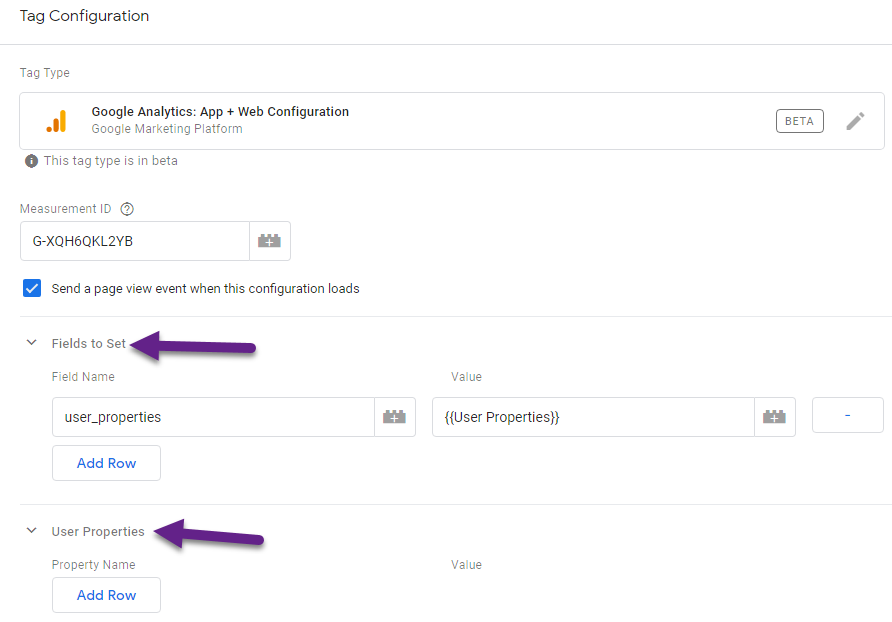
You can define User Properties either via “Fields to Set” or directly via the “User Properties” field. Keep in mind that there is a limit of 25 user properties in Google Analytics.
15. Views
Views are directly related to the Google Analytics account structure.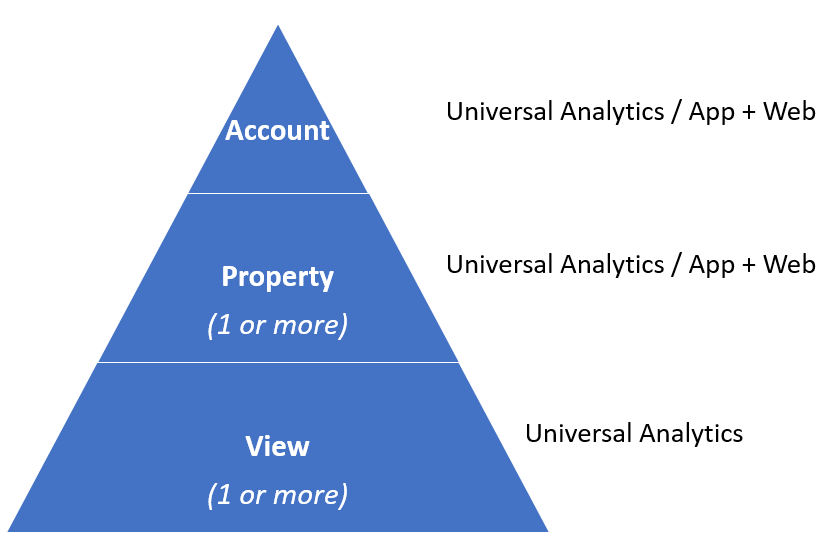
A view or reporting view is a subset of an Analytics account property that can have its own unique configuration settings. The concept of “reporting views” is (currently) not available in Google Analytics App + Web.
You can work with data streams, use filters and build audiences, but there is no way to set up specific views with unique settings in the admin section of Google Analytics.
16. View Filters
Not surprisingly, view filters are currently not available in Google Analytics App + Web. This is quite logical as view filters are stored at the account level, but work at the view level.
In App + Web properties you can apply filters, but they are directly created in the reporting environment, similar to standard table filters in Universal Analytics.
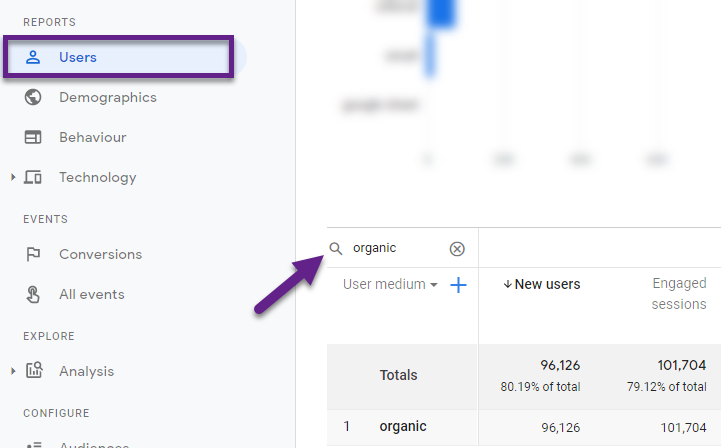
17. Regular Expressions
I am a BIG fan of regular expressions. They are incredibly powerful in many cases!
In Universal Analytics you can literally apply them everywhere.
So I became a bit disappointed after applying them as a table / reporting filter in Google Analytics App + Web. The medium “email” should be returned here, but no results come up.
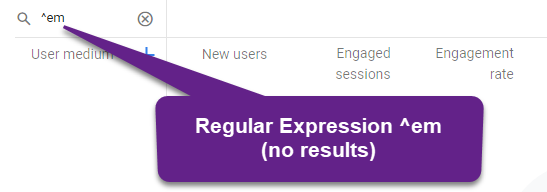 It looks like they are available in App + Web properties, but not in all places yet.
As an example, you can apply them when creating audiences.
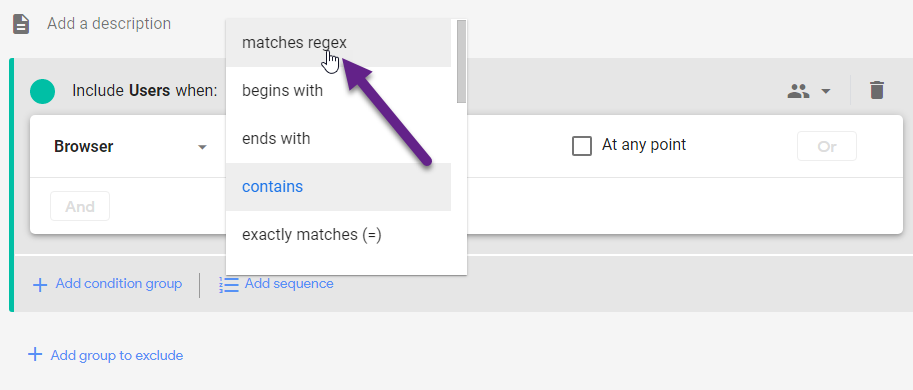 I recommend – if you are familiar with regular expressions – simply trying it out in Google Analytics App + Web. Undoubtedly, they will become more widely available in the new version in the future.
18. Standard Reports
You will be a bit disappointed if you heavily rely on the standard reports in Universal Analytics.
App + Web no longer comes with the ABC reporting structure that you find in Universal Analytics.
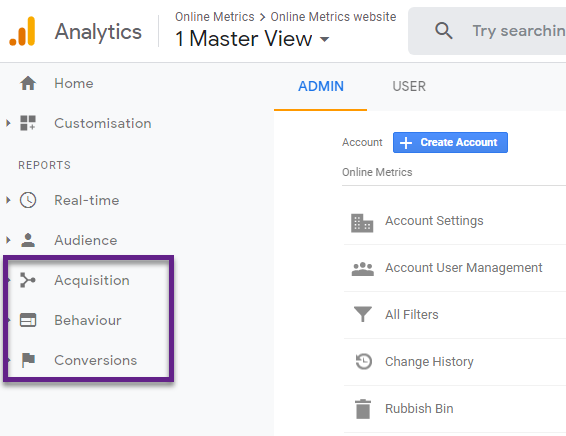
And the number of standard reports in Google Analytics App + Web is much lower compared to Universal Analytics.
At the time of writing there are only four standard reports available.
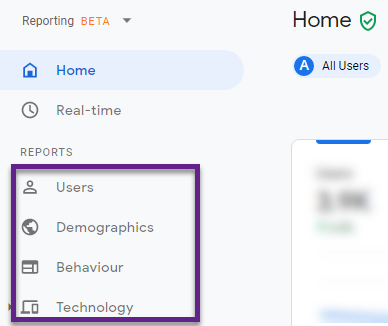 Each report consists of several “cards”. And behind most “cards” there is a detailed report with an even more comprehensive view of the user.
Also, I expect this section to grow over time.
19. Custom Reports
Another great feature of Universal Analytics are the so-called custom reports. And as you might have guessed, they are not available anymore in Google Analytics App + Web properties.
However, there are two new features/areas that are awesome to mention in this respect. The first one is called “Analysis” and this is a fantastic area to explore your data in great depth. This feature was previously only available in GA 360 and you now get if for free!
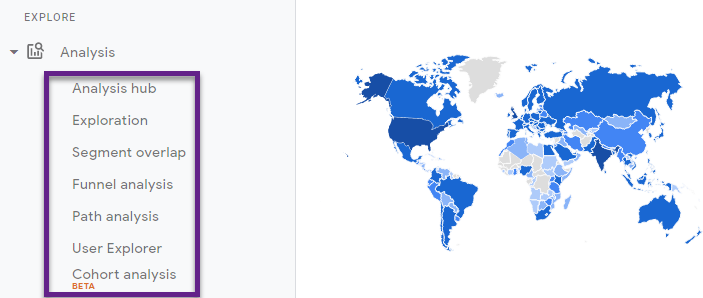
Here you can create reports and analyze user behaviour in any angle you would like. The options are (almost) endless.
And then there is Google BigQuery! Google BigQuery is Google’s cloud data warehousing solution and it is available for free in Google Analytics App + Web. We will discuss the advantages in the last part of this blogpost.
20. Funnels
Funnel analysis – not the limited Google Analytics goal funnels – were previously only available in GA 360.
And now, with the extra option to upgrade to open funnels, they are available for free in Google Analytics 4. You can find this area via Explore > Analysis > Funnel Analysis.
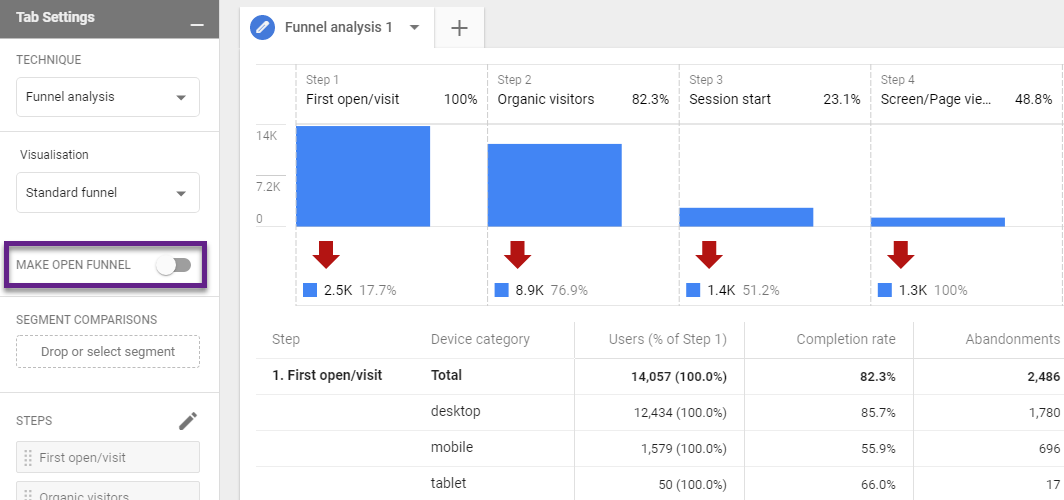
Extremely powerful to analyze a subset of your users across a wide range of actions/events on your website!
21. Segment Overlap
“Segment overlap” analysis is only available for GA 360 customers in Universal Analytics.
In Google Analytics App + Web properties everyone can benefit from this analysis.
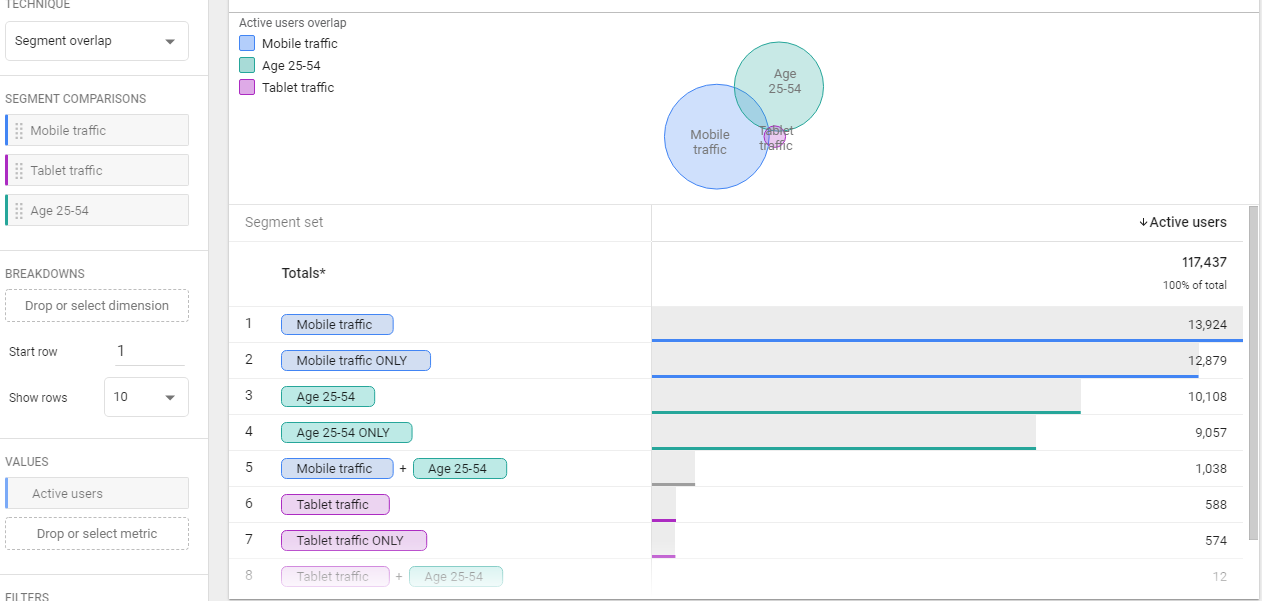
It’s a great analysis technique that visualizes the relationship between multiple segments of users.
Here are three examples of what you can do with this analysis and report:
- Include up to three segments to compare visually and via table to find out what the overlap of users is.
- Breakdown this overlap by a desired dimension.
- Create a segment or audience from a desired overlap/breakdown to action on.
22. Pathing
We all remember the behavioral flow and user flow reports of Universal Analytics. Let’s be honest, in most cases they don’t deliver great insights.
Now, in Google Analytics App + Web, there is a far more refined analysis technique available: Path analysis. (previously only available to GA 360 customers)
Path analysis is a new technique in the Analysis section of Google Analytics App + Web that allows users to explore the paths that visitors take on their websites and apps.

You can set up a path analysis from a starting or end point, very powerful! And the possibilities are literally endless.
Here are a few examples:
- Apply filters and/or segments to your path to narrow down the subset of users you want to analyze.
- Customize each step to be either an event or a page/screen view.
- Add up to 10 steps max and expand all available paths where desired.
- Explore pathings across sessions (!)
Here is quick example with one page filter applied on “STEP + 1”:
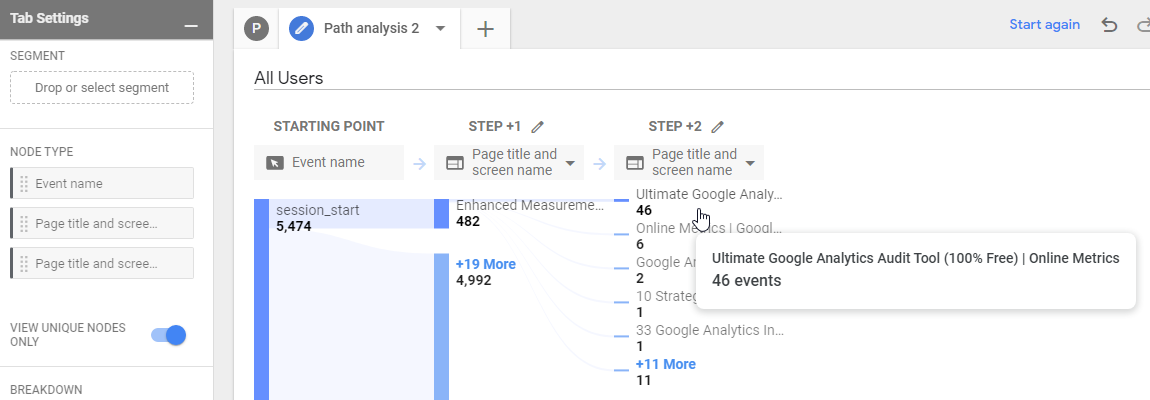
You can find this new analysis technique under Explore > Analysis > Path analysis.
23. User Explorer
You can find the User Explorer report both in Universal Analytics as well as Google Analytics App + Web. However, they are located in a different section.
Universal Analytics
Navigate to Audience > User Explorer.
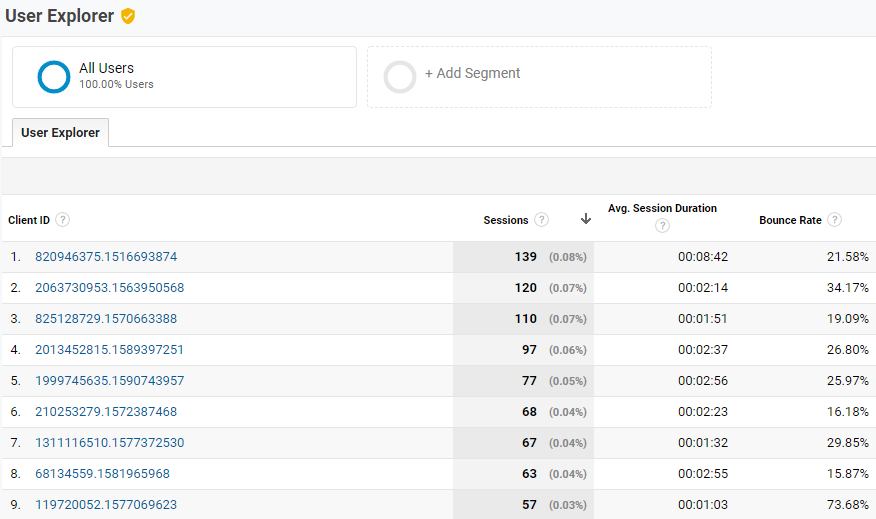
Read this guide to learn more about this User Explorer report in Universal Analytics.
Google Analytics App + Web
Navigate to Explore > Analysis > User Explorer.
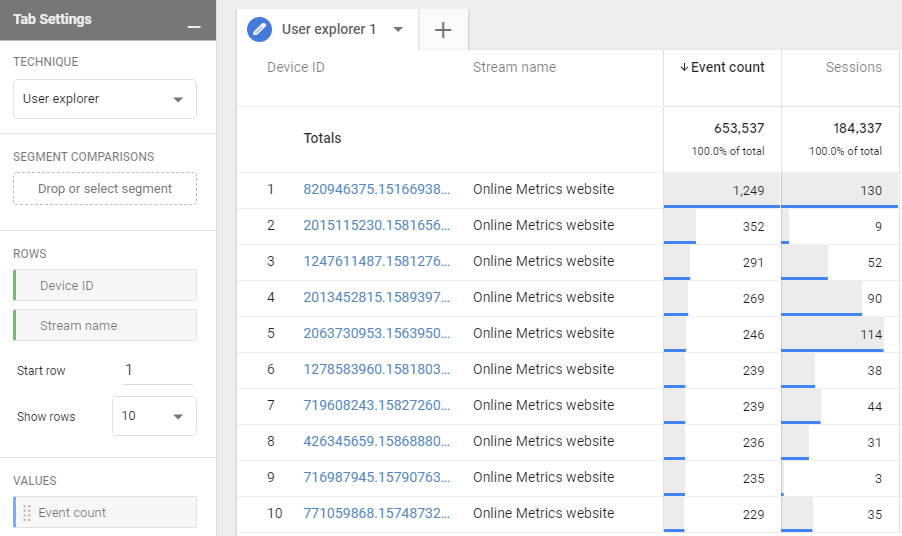
Here is a support doc from Google to learn more about this new User Explorer report/analysis.
As expected, the exact details in both reports are different. We have moved from a session to user (and event) focus in Google Analytics App + Web.
Note: Client IDs appear in the report by default for properties that aren’t enabled for User-ID.
24. BigQuery Integration
As mentioned earlier in this article, the BigQuery integration is now available for free in Google Analytics App + Web! Previously it was a paid feature in Universal Analytics.
I have mixed feelings on this one…
From one side this is amazing news as it allows us to really go deep on the analysis side and explore the data in certain ways where the UI is (currently) lacking. BUT, do you have the (internal) knowledge (e.g. SQL) required to take advantage of this enormous set of raw data? And do you expect to integrate, analyze and optimize on data from all kind of sources?
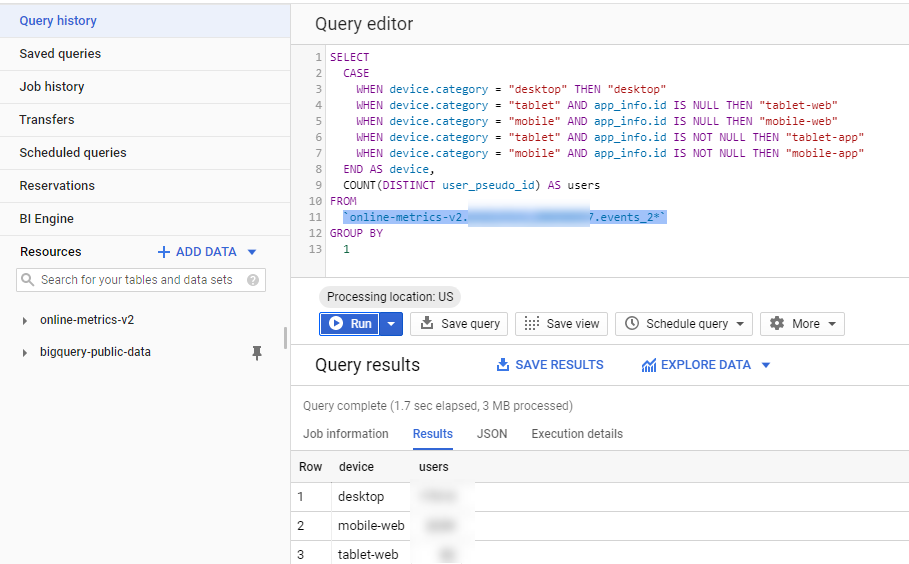
I believe there are many companies out there not being able to take advantage of this new (free) integration. And they might not be able to work around the limitations of the interface. But that concern will be addressed by Google.
One reason (there are many) why you probably want to set up an integration with Google BigQuery:
“In Google Analytics App + Web we collect events with associated parameters. In the UI we need to enable each custom parameter that we want to report on and there are currently strict limits. 50 Text parameters and 50 number parameters can be enabled per event and per project. Because of these limits, you probably won’t see all of your customized data in the UI. Therefore, Google BigQuery to the rescue as these limits don’t apply here!”
25. Other Integrations
Universal Analytics is known to integrate with a wide range of Google Analytics products.
I am sure all these integrations will become available in Google Analytics App + Web as well, but some are not available yet. Here are a few tools that are not yet integrated:
- Search Console
- Display & Video 360
- Search Ads 360
Again, this is an area where Google is working on and this should hopefully soon be resolved.
I realize this was quite a long post (over 3,000 words), but I hope it was useful to read!
Now it is your turn! I am sure there is more to say about this topic. What are your thoughts on key differences between Universal Analytics and Google Analytics App + Web?
One last thing... Make sure to get my automated Google Analytics 4 Audit Tool. It contains 30 key health checks on the GA4 Setup.
Hi Paul,
I am trying to get my head around such a simple thing as Campaign tagging for A+W. UTM etc.
Is it the same as for UA?
Hi Anders,
Good question. Yes, UTM tracking is still valid. I recommend using the source, medium and campaign parameter.
Best,
Paul
how to track conversions in GA4? Thank you!
Hi Paolo,
Please see these links for more information; it works differently from what you are used to.
https://twitter.com/CharlesFarina/status/1316445035685187587
https://www.bounteous.com/insights/2020/04/01/reporting-google-analytics-google-analytics-4-properties/#conversions-events-event-parameters
Best,
Paul
Hi Paul!
I don’t know how to view session keyword and content in the new GA property.
How can I check the utm_content and utm_term information from the UTM in the new GA Property?
Hi Ruu,
Unfortunately, it seems like Google has not yet made these parameters directly available in Google Analytics. They are part of the request, but cannot be accessed yet in the GA4 reporting interface and/or analysis hub.
A lot of things are still in progress, the same with using RegEx in the GA interface which is a big pain.
Best,
Paul
Hi Paul,
I am trying to get my head around such a simple thing as Campaign tagging for A+W. UTM etc.
Hi there, campaign tagging works exactly the same as in Universal Analytics. However, it seems that in GA currently only the medium, source and campaign parameter are supported.
Please also see: https://developers.google.com/analytics/devguides/collection/ga4/tag-guide
“Audiences let you segment users in ways that are relevant to your business. You can combine events, parameters, and user properties along with the Source, Medium, and Campaign dimensions to create practically any subset of users.”
Great article. I have to read up more but will these new parameters be able to be worked on and setup by standard to advanced Google Analytics users with minimal coding knowledge or will they need to be setup by developers in your opinion?
Hi Ronnie,
In general to get the most out of the implementation, you will usually always work together with developers.
It really depends on what you are trying to achieve, but basic things can be done by anyone with a bit of coding knowledge. Again, it is all about what you are trying to setup.
Best,
Paul
Good article. I would like to read more, but will these new parameters work and upgrade Google tics analytics with minimal coding knowledge set by users’ standard or will they need to be installed by developers in your opinion?
You can a lot by yourself if you are skilled in GTM/GA. And it’s helpful if you have some JavaScript knowledge as well. It really depends on what you are going to measure and how you want to retrieve the data. For example, a dataLayer is usually implemented by a developer.
Hey Paul,
I’m trying to get my head around such a simple thing as Campaign tagging for A+W. UTM etc.
Yes, everything has changed quite a bit. Just let me know if you have any questions regarding that topic.
Hello Paul, do you know how marking an event as a conversion affects the user who has not consented to data processing? Thank You!
Hi Peter,
Both the event as well as the conversion are not measured if the user does not consent and thus is not tracked.
Best,
Paul