Have you ever thought about looking at Google Analytics dimensions in multiple ways? After reading this article you know that different data angles lead to a whole heap of new insights.
Most of you probably know that metrics and dimensions are the foundation of all reports in Google Analytics.
So every analysis starts with at least one metric and one dimension.
I won’t deal with custom dimensions this time, but you can read about this great feature in a future post!
Ok, I will start out easy and it gets more advanced toward the end.
Standard Report in Google Analytics
Before going into details I like to share a standard Google Analytics report with you:
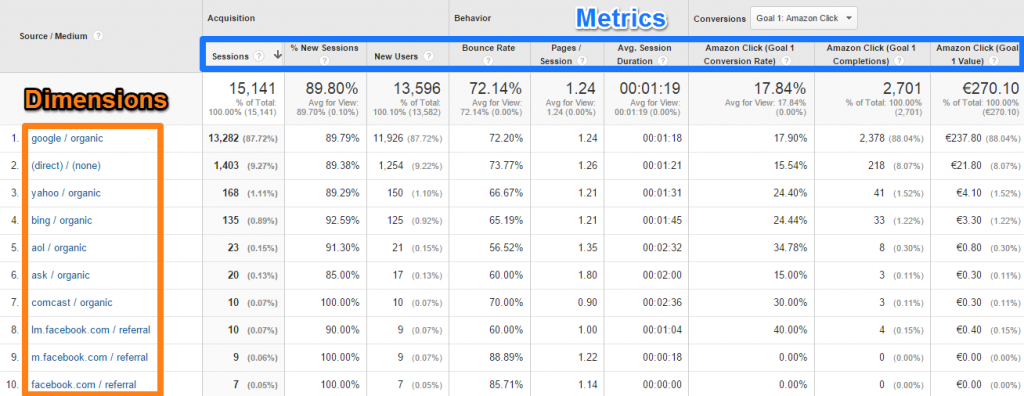 This is just a simple overview of one dimension (in this case “source/medium”) and a set of ABC metrics.
ABC stands for Acquisition, Behavior and Conversions.
One of the great minds behind this reporting structure is Avinash Kaushik.
You all know him, right?
1. Primary Dimension
This leads to the first way of approaching a dimension. It’s the default situation if you click on one of the reports in Google Analytics.
In the screenshot shown above “source/medium” is the primary dimension.
Why to use it:
Primary dimensions provide you with high-level insights in how a dimension performs in relation to a set of metrics. In this example it shows you how the different traffic sources perform against a standard set of ABC metrics.
Tip: read this article about campaign tracking if you need to get a better understanding of the different channel parameters in Google Analytics.
2. Secondary Dimension
Let’s go one level deeper. You can also build a report where “source/medium” is applied as the secondary dimension:
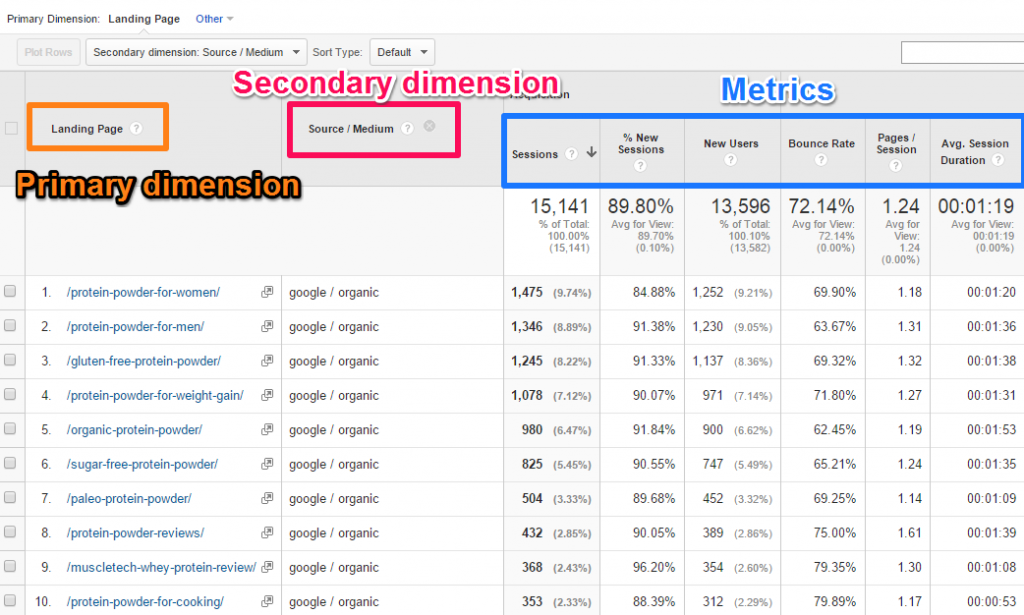 Do you see what has happened? I have chosen “landing page” as the primary dimension. “Source/medium” is now the secondary dimension.
Why to use it:
Secondary dimensions provide you with a unique way to cross-segment one dimension against another. In this example it shows you how the different landing pages perform in relation to the traffic sources (defined as “source/medium”).
Tip: export this data to Excel and build a pivot table to derive insights more easily.
3. Tertiary Dimension
Do you know that you can go one level deeper here?
It’s really cool:
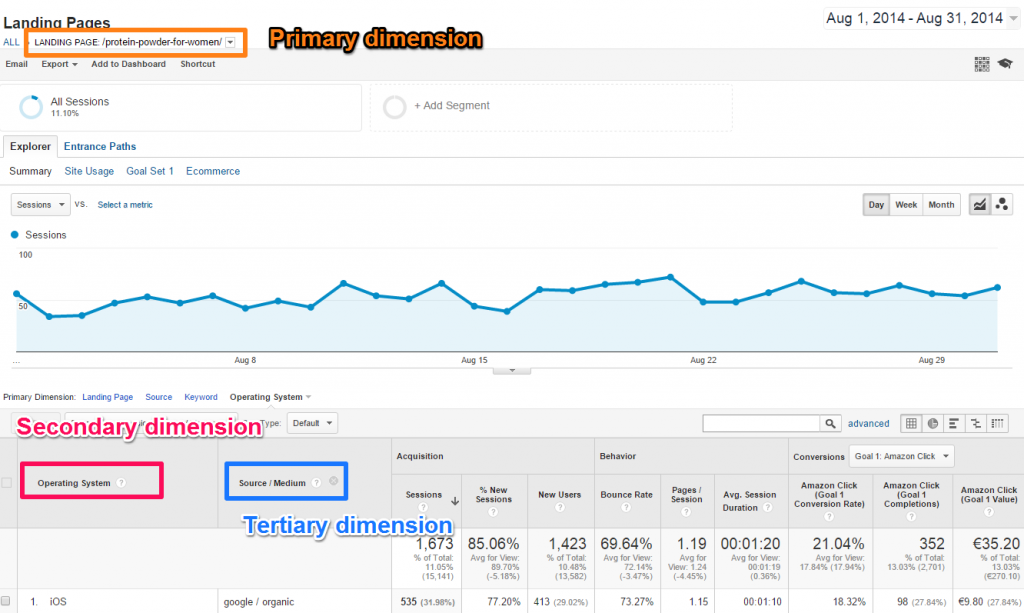
How to achieve this:
- Select landing pages report.
- Click on the landing page you like to dive into (/protein-powder-for-women/).
- Change your primary dimension to operating system (which now becomes the secondary dimension).
- Select as your secondary dimension source/medium (which now becomes the tertiary dimension).
Why to use it:
Tertiary dimensions provide you with a unique way to double cross-segment one dimension against two others. It’s especially useful if you have a large data set and you want to dive deeper into one value. In this example it shows you how one landing page performs in relation to operating system of user and source/medium (where the user came from).
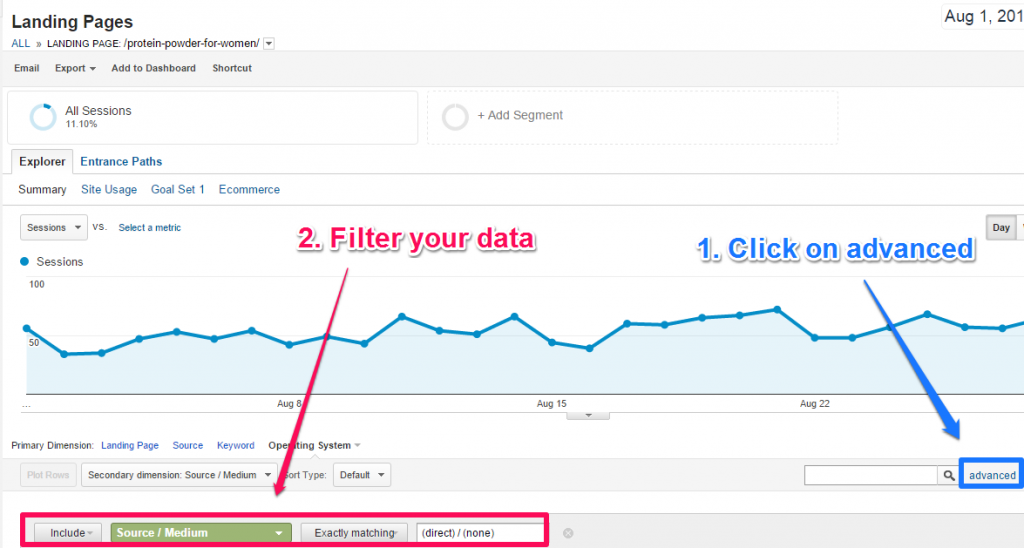
Tip: you can add a filter on a particular “source/medium” if you only want to show the data related to that segment.
4. Dimension in Custom Segment
Google Analytics does a tremendous job in helping you analyze segments of Google Analytics data on the fly.
In our example we looked at “source/medium”.
You can filter most report data on only one “source/medium” by applying one segment.
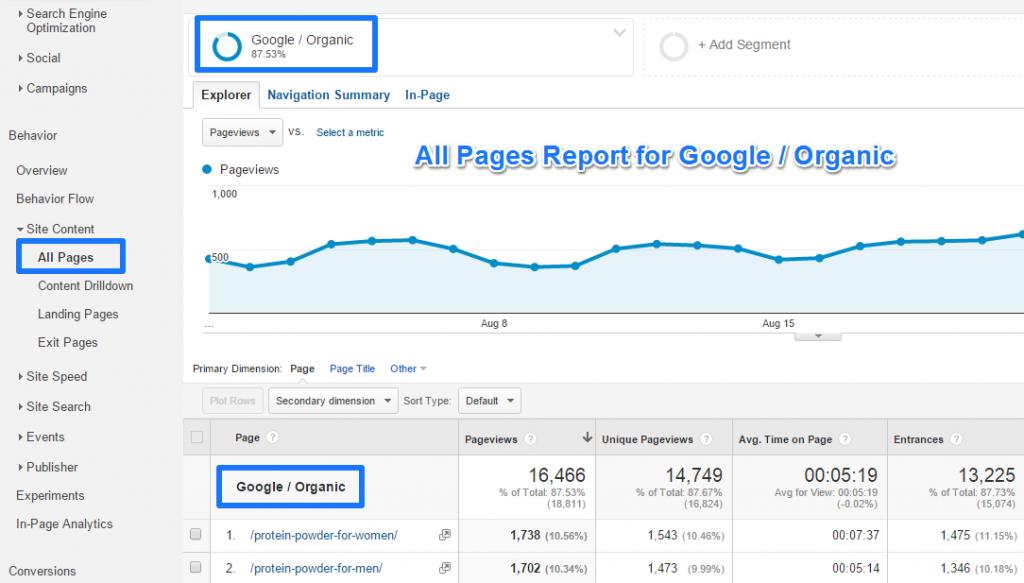
I have built a segment on “google/organic”:
 If you apply this segment to your data, your reports will be fully focused on this traffic source.
Here is an example report:
Why to use it:
Segments offer a tremendous opportunity to view one dimension and a specific value in context of many different reports. In this case I have segmented on “google/organic” and can view all reports for this dimension. It delivers me a great deal of information on how this particular dimension performs against many other metrics and dimensions.
Tip: read this article about settting up segments (in general) and/or take a look at 20 custom segments for ecommerce sites to further educate yourself on segmentation.
5. Multiple Dimensions in Custom Segment
Besides segmenting on one single dimension, you can combine multiple segments in one analysis.
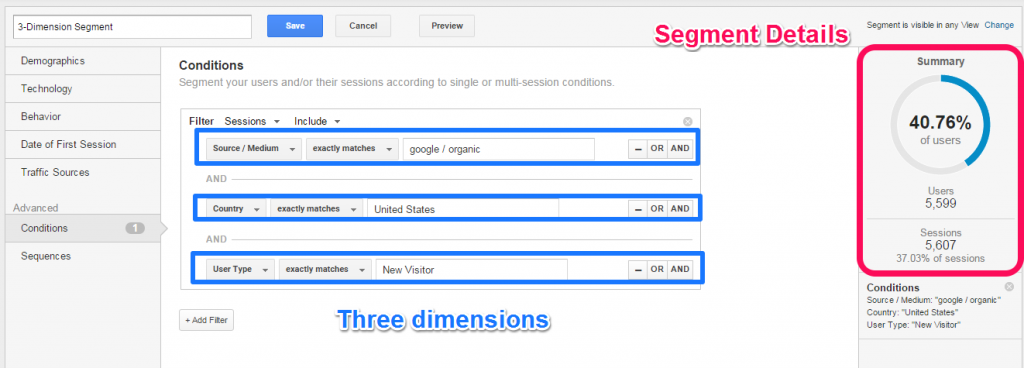
Let’s assume you would like to combine the following dimensions:
- Source / medium = google / organic
- Country = United States
- Type of visitors = New
It’s easy to set this up:
 After you have applied this segment in the reporting interface, you can view the three different reports that are connected to each of your segments:
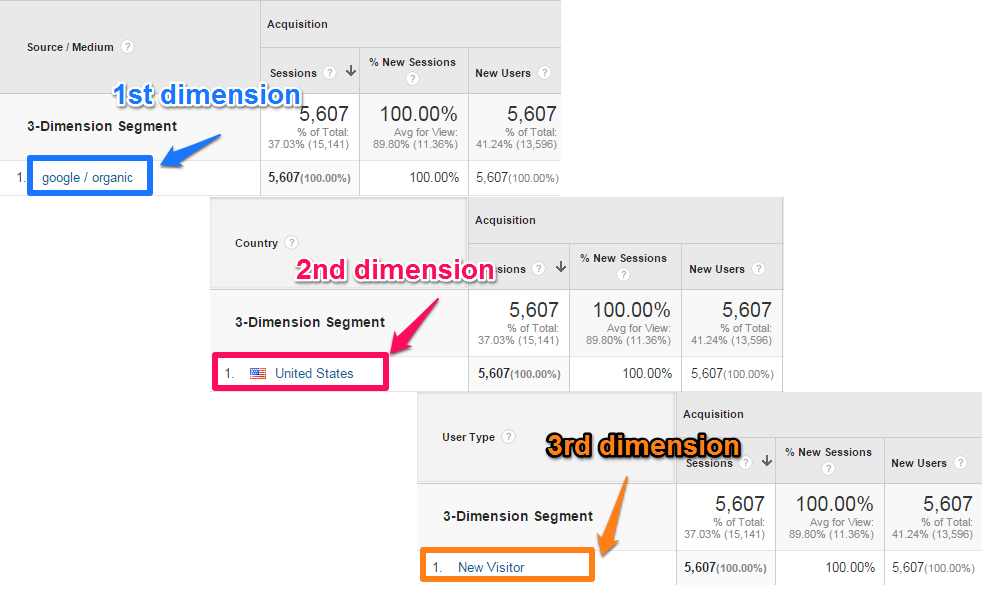 This ensures your segment set up is done in the right way.
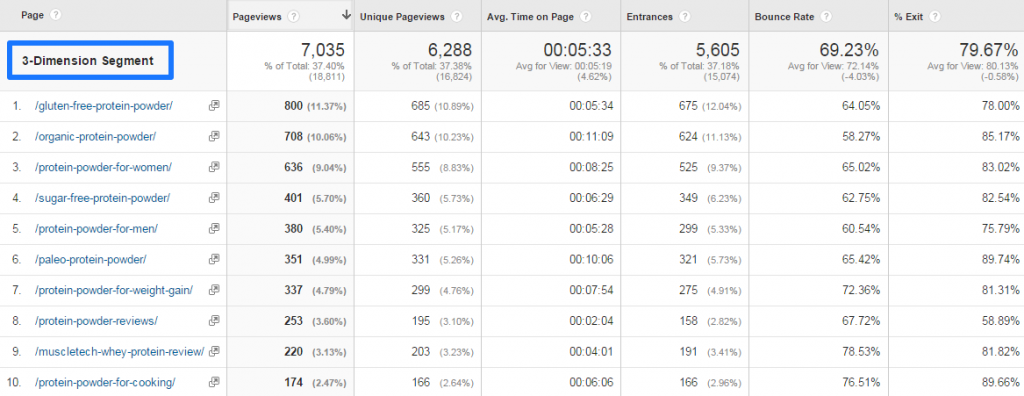
I have already shown you the All Pages report with one dimension. Here is the same report with the new segment:
Why to use it:
Combined segments bring even more context to all the different reports you take a look at. In this case I have segmented on “google/organic”, “United States” and “New”. All reports are now focused around the combination of these dimensions. It delivers me a great deal of information on how a micro-segment performs.
Tip: read this article about settting up segments (in general) and/or take a look at 20 custom segments for ecommerce sites to further educate yourself on segmentation.
6. Dimension and Custom Report
Custom reports come in scope if you want to review one or more dimensions in context of a chosen set of metrics.
You can deviate from the default report settings here.
Two options:
- Combine multiple metrics from different report tabs.
- Come up with a complete new metrics reporting structure.
As an example please see the custom report (flat table) set up below:
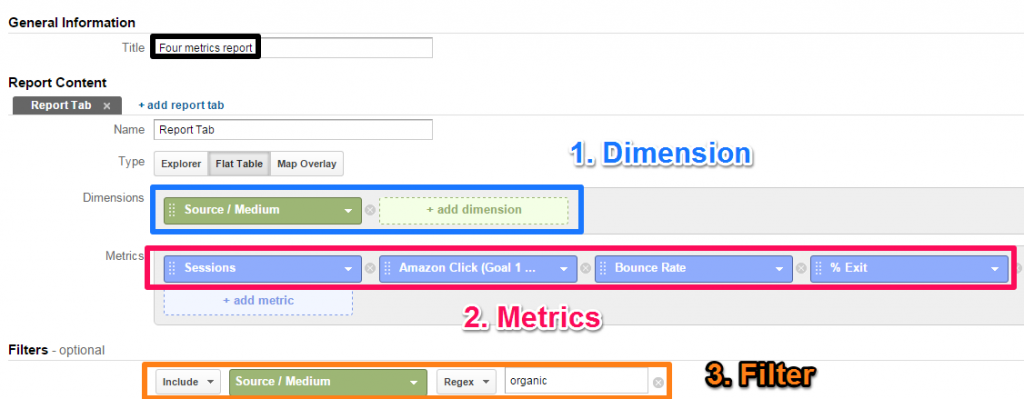
And this is how the actual report looks like:

Why to use it:
Custom reports with one dimension provide you with a lot of flexibility. You can combine one dimension or micro-dimension with your favorite metrics or KPIs. You can also change the order in which the different metrics are displayed. This makes it easy to evaluate or monitor one dimension without having to view many different reports.
Tip: a great collection of custom reports by Avinash to get inspired. I have written a post on table filters you might want to check out as well.
7. Multiple Dimensions and Custom Report
I like to share one additional way to work with dimensions in Google Analytics: multiple dimensions combined in a custom report.
In order to get this to work you need to use a flat table. Within a flat table you are able to select up to five dimensions.
Here is an example set up with three different dimensions:
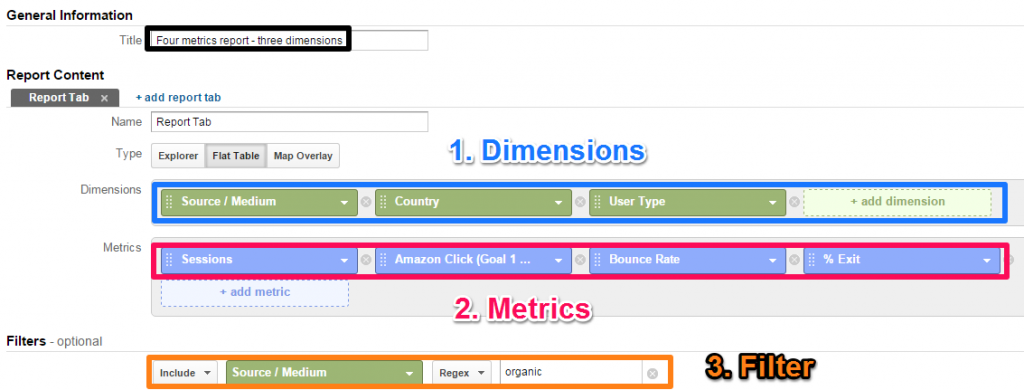 The actual report looks like this:
 Working with multiple dimensions and a flat able can work, but visually it doesn’t look very appealing.
Why to use it:
Custom reports with multiple dimensions can provide you with interesting insights on a micro-segment level. You have a lot of flexibility on which metrics and dimensions you include and in what order. If you want to, you can even pre-filter you data on one or more dimensions.
Tip: automate your Google Analytics data export if you like to work with multiple dimensions. And educate yourself on metrics and dimensions with this handy overview.
Well, this is it. I really hope you have learned some cool new things here.
What’s your experience in working with dimensions? Do you always look at plain reports or are you creative to look at your data in different ways? Happy to hear your thoughts!
One last thing... Make sure to get my automated Google Analytics 4 Audit Tool. It contains 30 key health checks on the GA4 Setup.
Hi Paul
Very usefull like usually!
I’ve been working tracking events and I found that when adding a secondary dimension the total number of unique events is less than without a secondary dimension (in this case source)
Do you know why happen that?
Hi Juan,
Thanks for your comment and I am glad this article is useful.
I have checked your finding in different accounts and could not reproduce it.
First I thought about sampling, but it seems sampling already occurs at the overall level in the reporting view for events.
One thing you might want to check: set the “Control the number of sessions used to calculate this report:” to highest precision. You can do this in the top right of the screen. And make sure to also have this selected when you apply the secondary dimension.
If this doesn’t help, I recommend to add a comment in the Google+ Google Analytics community. Someone should know the answer!
Thank you,
Paul
hi poul
your content is just make me happy every time:)
I have a question about using segment and dimension
In tip number 6 when you use custom segment and use three dimension, can we use primary and secondary dimension as well?
and now drill down even more?
That’s great to hear Afshin! :-) Yes, you can combine multiple dimensions and apply a segment as well. However, keep in mind that “how to interpret the data” becomes more difficult when applying segments.