Google Analytics can deliver great insights and help you optimize your online business in a smart way.
However, it takes some time and experience to dig through the clutter.
Setting up an efficient reporting and optimization structure is not an easy task either.
Metrics and dimensions are two crucial terms you need to grasp to really understand and master Google Analytics.
After reading this post you know all about the why and how behind metrics and dimensions.
Interested in Google Analytics 4: read this post about GA4 metrics and dimensions.
Introduction to Metrics and Dimensions
Let’s start with sharing a random, example report with you:
This report consists of:
- Two dimensions: Medium and Country
- Three Metrics: Sessions, % New Sessions and New Users
On default, Google Analytics shows just one dimension in their standard reports.
A simple trick helps you to add secondary (and even tertiary!) dimensions to your reporting set.
The next section contains 10 different aspects of metrics and dimensions I recommend to read carefully.
1. Know the Difference
Before diving into other related topics, you need to understand the difference between dimensions and metrics.
Some people might think and say:
“A metric is tied to a number and a dimension isn’t.”
In most cases this is true, but unfortunately not always.
Two examples of dimensions that are actually numbers:
- Hour of day
- Screen resolution
So how can you distinguish between them?
- A dimension is a characteristic of an object that can be given different values —> a dimension describes data
- A metric is an individual element of a dimension which can be measured as a sum or ratio —> a metric measures data
For more information I recommend to visit this Google Analytics help article on dimensions and metrics. It clearly explains the difference between them.
2. Use Them as Building Blocks of Your Reports
In Google Analytics you have 80+ standard reports that contain a lot of information.
It depends on your business, KPIs and what you are trying to optimize which reports are useful and which are not.
Pick the reports based on what you are trying to solve or improve.
Tip: always start with a question before you get lost in your Google Analytics data.
Besides this huge set of standard reports, Google Analytics let’s you fully customize your reports.
Custom reports are a great help in combining metrics and dimensions that fit your business in the best way.
Literally all Google Analytics reports are based on combinations of dimensions and metrics.
You can choose to start from scratch when building custom reports. However, it might be more efficient to take your standard reports as your starting point.
3. Apply Them to Better Understand Your Audience
A while ago I wrote a post on the adjusted bounce rate metric. I was happy to receive this comment from one of my valuable readers:
 I have answered to Saif that I agree – in general – that an overall bounce rate below 40% is quite good.
However, it doesn’t tell the complete story.
I will explain it with an example:
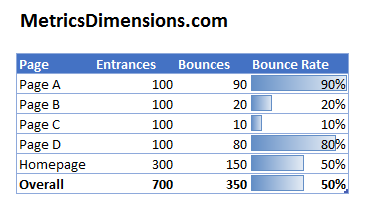 The website MetricsDimensions.com has 700 entrances in period X.
In total there are five landing pages, including the homepage. Bounce rates vary from 10 to 90% with an average of 50%.
Without segmenting your data (and using dimensions) you would focus on the 50% number.
Please note: most of the time averages do lie.
In this particular case it seems that the audience loves page B and C and hates page A and D.
Is this huge difference related to any particular traffic sources or device types? Or what other factors do influence these numbers?
Segmentation based on dimensions is very important if you want to understand your audience better.
It’s easy to fall in a trap and draw wrong conclusions.
4. Build Powerful Segments
In my last point I did explain about using dimensions to understand your data and audience better.
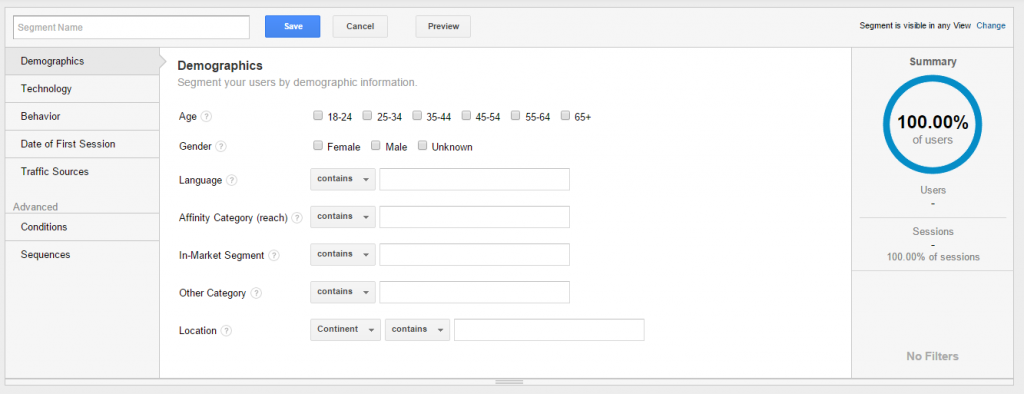
Besides applying them directly in reports, Google Analytics contains a great segment building module:
You have missed a great deal of optimization opportunities if you haven’t used this module yet.
What does it have to do with metrics and dimensions?
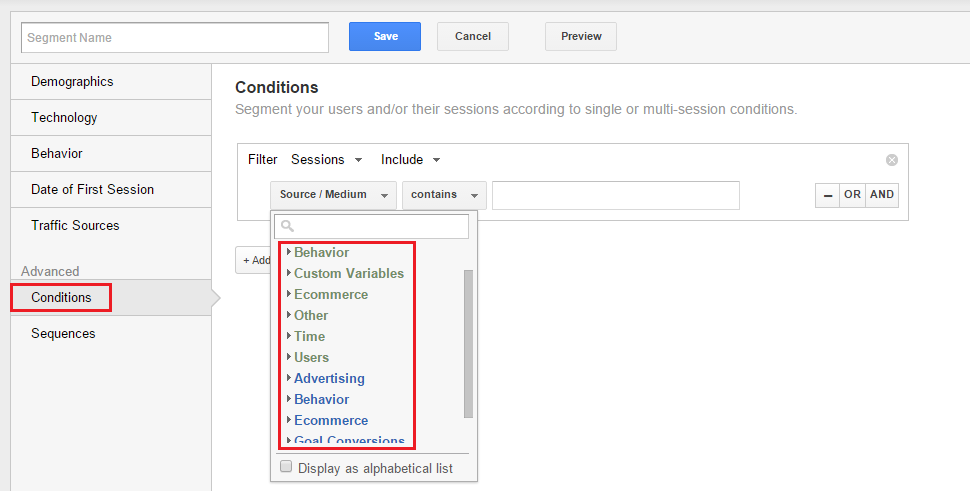
Well, metrics and dimensions are important building blocks for custom segments (they can be applied to almost all reports in Google Analytics):
A few things to note here:
- Dimensions are always in green and are tied to a character match (e.g. contains, does not contain, matches regex etc.)
- Metrics are always in blue and are tied to a calculative matching condition (e.g. =, >, < etc.)
- Sometimes there are metrics and dimensions in the same group. For example: Behavior and Ecommerce.
- It is not possible (yet) to apply metrics and dimensions to your goal funnel reports. Happily there are a few smart ways to segment your funnel reports.
Make sure to check out dimensions and metrics in the segmentation building environment!
5. Don’t Memorize the Complete List
There are simply too many metrics and dimensions in Google Analytics.
You will get a headache and there is no need for knowing them all.
If you are getting more and more proficient in working with them, you will know which are useful and in what situation.
What type of site is involved and what are the main KPIs? Are there any segments that can be listed upfront?
Select the ones that are in line with your business goals.
It happens that old metrics vanish and new metrics are added to the list.
Example: last year the metric visits changed into sessions.
6. Know That Not All Metrics and Dimensions Go Together
There are virtually unlimited combinations of dimensions and metrics to build the reports that suit your needs.
However, it is possible some of your combinations might not work out.
Two easy ways to find out whether metrics and dimensions make a good match:
- Building a custom report and see whether any results are returned
- Use this ever evolving list of metrics and dimensions in Google Analytics
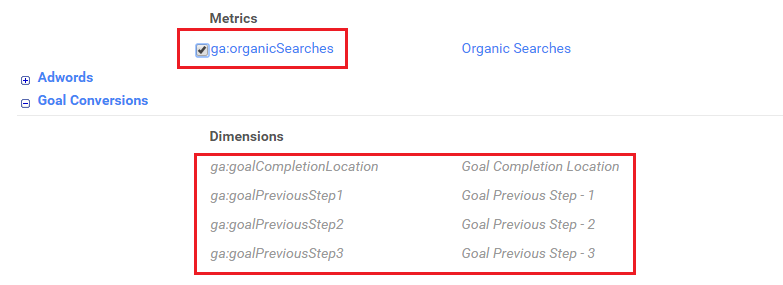
The second option reveals which metrics or dimensions don’t match by simply graying them out.
Here is an example:
 7. Keep a List of Your Favorite Metrics and Dimensions
Are you working as a consultant with recurring, specific analysis needs?
I recommend that you keep a list of your most used metrics and dimensions. It helps you to speed up your analysis.
8. Use Them to Effectively Extract Data Via the API
In one of my latest articles I have explained about three ways to export data from Google Analytics.
Two of the options are related to using the Google Analytics API.
If you start using the API, the two most powerful building blocks of the API are dimensions and metrics.
One more reason to dive into them and learn at least the basics!
9. Understand That the API List Deviates from Segment List
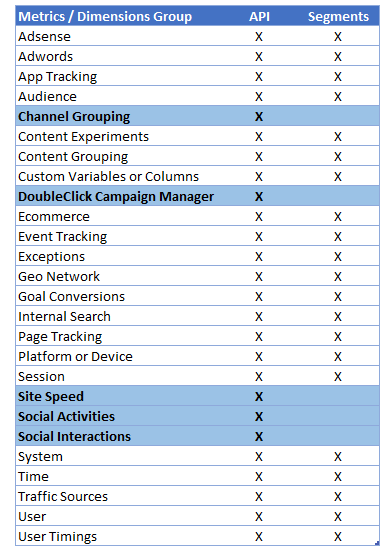
In the API you have a broader choice in selecting metrics and dimensions if compared to the ones you can use in Google Analytics segments.
At the time of writing this is the current list comparison:
At a quick glance you can see that the following groups are not available in segments:
- Channel Grouping
- DoubleClick Campaign Manager
- Site Speed
- Social Activities
- Social Interactions
10. Try Custom Metrics and Dimensions for Pros
The last point I like to make is about custom metrics and dimensions. Don’t think about this if you are just starting out.
If you have some experience and want to take your business and insights to the next level, this might be something for you!
The way Google Analytics puts it:
“Custom dimensions and metrics allow you to bring additional data into Google Analytics that can help you answer new questions about how users are interacting with your content.“
Recommended articles:
- Step-by-Step Guide to Leverage Custom Dimensions in Google Analytics.
- Complete Guide to Leverage Custom Metrics in Google Analytics.
Well, this is it.
I am a happy man – if you agree on how important and powerful these metrics and dimensions are after reading this post!
One last thing... Make sure to get my automated Google Analytics 4 Audit Tool. It contains 30 key health checks on the GA4 Setup.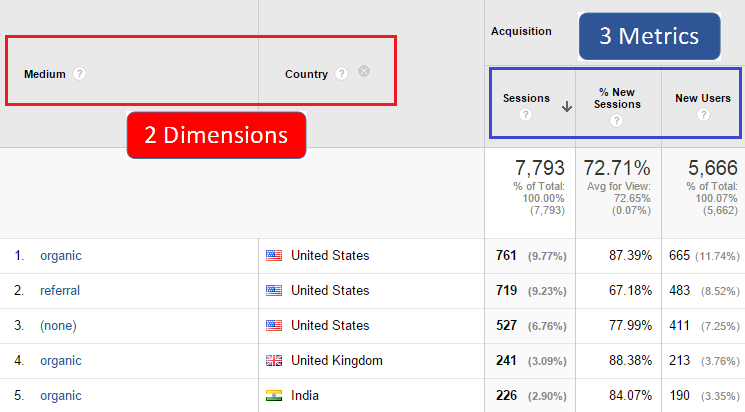

A very nice article, Paul. For a long time, Custom Dimensions have by far been at the top of my list of “best additions” to Universal Analytics. They reign supreme.
At first, I didn’t see much value to custom metrics. I have since changed my mind :-). While I REALLY wish that custom metrics could be scoped to the session or the user (instead of just hit or product), I find that they make reporting much more flexible and allow for the calculation of data points that were previously not possible (or at the least, really annoying to get at using Event Values). One particularly nice feature is the ability to set limits on the values of the metrics within the admin. This can save a lot of headaches as stupid outlier data can often be shoved into one’s GA account. (Ever see that guy who decides to add 1,000,000,000 items to cart?)
In any case, keep up the good work.
Cheers,
Yehoshua
Thank you for your kinds words! Oh yeah, I totally agree here.
It seems I have to follow your direction. :-) I have experienced with custom dimensions quite a bit, but custom metrics are still relatively new to me.
Best of luck,
Paul
very useful tips and information, needed to dig valuable data in GA. Thank you Paul.
Thanks for your comment and I am glad you like the article Luis!
Learned two important concepts today!
A Metric is used to measure data. A simple way to identify it is whether we can use mathematical symbols like >,=,<, etc to express them.
A dimension can be used to segment a sophisticated problem or data. It can be given different values. Normally it describes one type of metrics.
Thank you for your explanation, Paul.
Great to hear you now master another, new concept!